🔻 Disruption to Bullish Thesis
1. Resistance Zone Near Target
The "Target" area might align with a previous resistance level (historically where price has reversed or consolidated).
If price hits that zone, it could stall or reject, rather than break through.
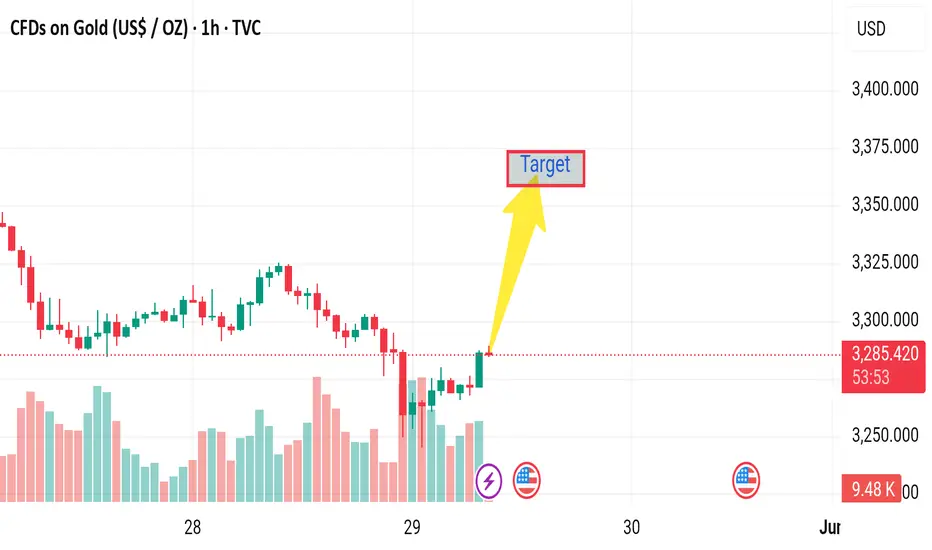
2. Bearish Volume Divergence
While the candles are green and pushing upward, volume is not increasing significantly.
Lack of strong buying volume can suggest a weak rally — potentially a bull trap.
3. Trend Context: Larger Downtrend
The chart shows a strong prior downtrend before the recent small upward push.
This move could be a dead-cat bounce or retracement within a broader bearish move.
4. Fundamental Risk: USD Strength
If the US Dollar Index (DXY) strengthens due to macroeconomic data or Fed commentary, gold (USD-denominated) typically drops.
The calendar icons suggest upcoming US economic data, which could disrupt gold’s movement.
5. Candle Structure Shows Exhaustion
The current bullish candles are smaller compared to previous strong red ones.
This may imply momentum exhaustion before reaching the target.
1. Resistance Zone Near Target
The "Target" area might align with a previous resistance level (historically where price has reversed or consolidated).
If price hits that zone, it could stall or reject, rather than break through.
2. Bearish Volume Divergence
While the candles are green and pushing upward, volume is not increasing significantly.
Lack of strong buying volume can suggest a weak rally — potentially a bull trap.
3. Trend Context: Larger Downtrend
The chart shows a strong prior downtrend before the recent small upward push.
This move could be a dead-cat bounce or retracement within a broader bearish move.
4. Fundamental Risk: USD Strength
If the US Dollar Index (DXY) strengthens due to macroeconomic data or Fed commentary, gold (USD-denominated) typically drops.
The calendar icons suggest upcoming US economic data, which could disrupt gold’s movement.
5. Candle Structure Shows Exhaustion
The current bullish candles are smaller compared to previous strong red ones.
This may imply momentum exhaustion before reaching the target.
t.me/gold_free_signals1
𝙁𝙤𝙧𝙚𝙭 𝙩𝙧𝙖𝙙𝙞𝙣𝙜 𝙚𝙭𝙥𝙚𝙧𝙞𝙚𝙣𝙘𝙚 𝙩𝙚𝙖𝙢 ☺️ 𝙢𝙖𝙣𝙖𝙜𝙚 𝙮𝙤𝙪𝙧 𝙖𝙘𝙘𝙤𝙪𝙣𝙩 𝙢𝙖𝙠𝙞𝙣𝙜 𝙢𝙤𝙣𝙚𝙮 🤑💰
t.me/gold_free_signals1
𝙁𝙤𝙧𝙚𝙭 𝙩𝙧𝙖𝙙𝙞𝙣𝙜 𝙚𝙭𝙥𝙚𝙧𝙞𝙚𝙣𝙘𝙚 𝙩𝙚𝙖𝙢 ☺️ 𝙢𝙖𝙣𝙖𝙜𝙚 𝙮𝙤𝙪𝙧 𝙖𝙘𝙘𝙤𝙪𝙣𝙩 𝙢𝙖𝙠𝙞𝙣𝙜 𝙢𝙤𝙣𝙚𝙮 🤑💰
t.me/gold_free_signals1
Disclaimer
The information and publications are not meant to be, and do not constitute, financial, investment, trading, or other types of advice or recommendations supplied or endorsed by TradingView. Read more in the Terms of Use.
t.me/gold_free_signals1
𝙁𝙤𝙧𝙚𝙭 𝙩𝙧𝙖𝙙𝙞𝙣𝙜 𝙚𝙭𝙥𝙚𝙧𝙞𝙚𝙣𝙘𝙚 𝙩𝙚𝙖𝙢 ☺️ 𝙢𝙖𝙣𝙖𝙜𝙚 𝙮𝙤𝙪𝙧 𝙖𝙘𝙘𝙤𝙪𝙣𝙩 𝙢𝙖𝙠𝙞𝙣𝙜 𝙢𝙤𝙣𝙚𝙮 🤑💰
t.me/gold_free_signals1
𝙁𝙤𝙧𝙚𝙭 𝙩𝙧𝙖𝙙𝙞𝙣𝙜 𝙚𝙭𝙥𝙚𝙧𝙞𝙚𝙣𝙘𝙚 𝙩𝙚𝙖𝙢 ☺️ 𝙢𝙖𝙣𝙖𝙜𝙚 𝙮𝙤𝙪𝙧 𝙖𝙘𝙘𝙤𝙪𝙣𝙩 𝙢𝙖𝙠𝙞𝙣𝙜 𝙢𝙤𝙣𝙚𝙮 🤑💰
t.me/gold_free_signals1
Disclaimer
The information and publications are not meant to be, and do not constitute, financial, investment, trading, or other types of advice or recommendations supplied or endorsed by TradingView. Read more in the Terms of Use.