---
## ✨ – Where Smart Capital Management Meets Predictive Precision
🔐 **Capital management is the cornerstone of survival and success in this market.** No matter how accurate the analysis or how powerful the pattern, risk control is what separates the seasoned trader from the reckless speculator.
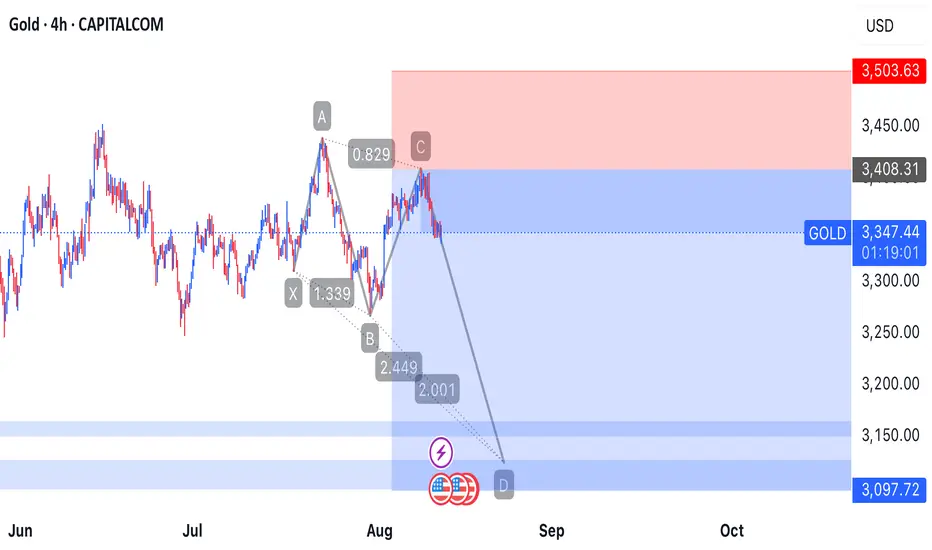
This chart highlights key buy and sell zones, backed by high-probability harmonic patterns such as:
### 🦋 Gartley Pattern
- Identified at a clear reversal zone
- Suggests a corrective move before trend continuation
### 🦂 Deep Crab Pattern
- Highly precise in spotting tops and bottoms
- Enabled a strong move from Sell Zone 2, achieving **560 points**,
---
### 📊 Defined Trading Zones:
| Zone | Trade Type | Potential Outcome |
|-----------------|------------|------------------------|
| Sell Zone 1 | Short | Moderate correction |
| Sell Zone 2 | Strong Short | Sharp bearish move |
---
### 📈 Technical Indicators:
- EMA (50, 100, 200) show mixed momentum signals
- X, A, B, C, D points mark the completion of harmonic setups with precision
---
🎯 **Bottom Line**:
Gold is navigating through sensitive technical zones. Predictive harmonic patterns offer a forward-looking edge, but without disciplined capital management, they remain mere possibilities.
**Be strategic, not just bold.**
Disclaimer
The information and publications are not meant to be, and do not constitute, financial, investment, trading, or other types of advice or recommendations supplied or endorsed by TradingView. Read more in the Terms of Use.
Disclaimer
The information and publications are not meant to be, and do not constitute, financial, investment, trading, or other types of advice or recommendations supplied or endorsed by TradingView. Read more in the Terms of Use.