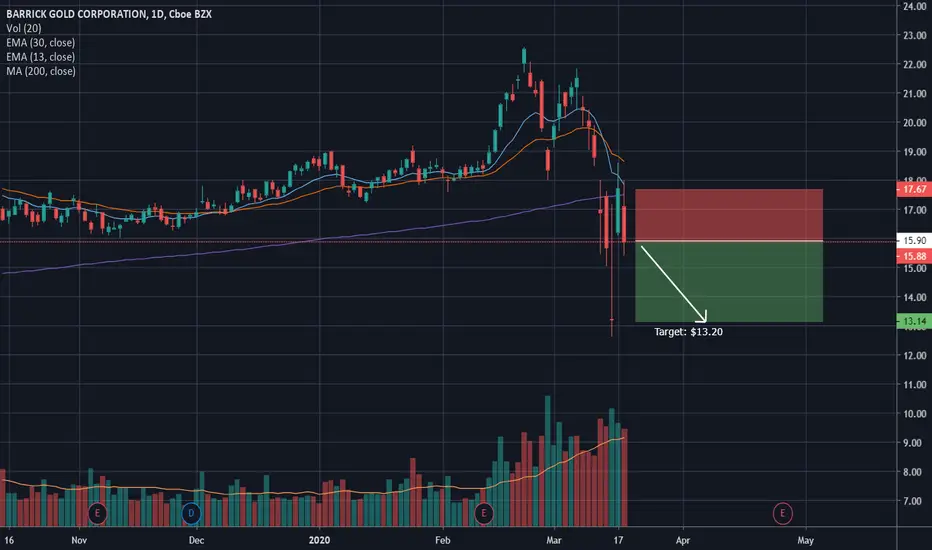
GOLD ran up into its 200sma on the daily chart and held a red close the next day. This is an indicator for a pullback play back to the lower level . The moving averages are pushing GOLD back down.
Disclaimer
The information and publications are not meant to be, and do not constitute, financial, investment, trading, or other types of advice or recommendations supplied or endorsed by TradingView. Read more in the Terms of Use.
Disclaimer
The information and publications are not meant to be, and do not constitute, financial, investment, trading, or other types of advice or recommendations supplied or endorsed by TradingView. Read more in the Terms of Use.