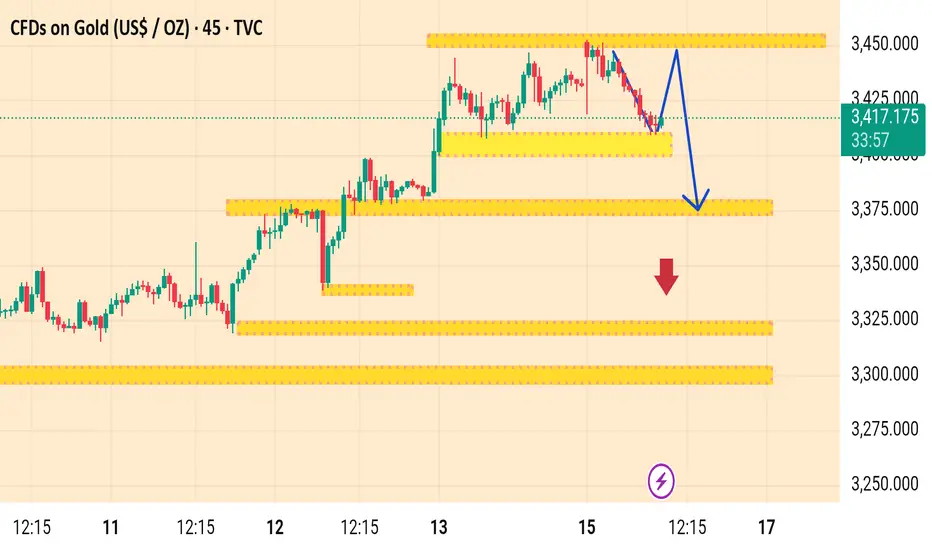
The chart you provided is a 45-minute time frame analysis for Gold CFDs (US$/OZ). Here's a breakdown of the key elements and what they suggest:
---
Current Price
$3,414.93, down -18.42 (-0.54%)
---
Analysis Summary
Price Action
The price has recently rejected from a resistance zone (around $3,445–$3,450).
It is currently pulling back, heading downward from this resistance.
Support Zones Highlighted
Multiple horizontal yellow zones mark previous support/resistance levels.
The key immediate support level lies near $3,400–$3,405.
A deeper support area is visible around $3,360–$3,365, and further below near $3,320.
---
Forecast Indication (Based on Markings)
A short-term pullback (blue arrow up) may retest the breakdown level (~$3,430).
Then, a potential drop toward the next support at $3,360 is expected (blue arrow down).
A bearish continuation scenario is emphasized with a red downward arrow, suggesting price may head further down to the $3,320 area if $3,360 fails to hold.
---
Implications for Traders
Bearish Bias: Suggested by the forecast arrows and recent resistance rejection.
Potential Setup:
Short on pullback near $3,430 (if price fails to reclaim this zone).
Target: $3,360 and possibly $3,320.
Stop-loss: Above $3,450 resistance.
---
Would you like a trading plan or signal based on this analysis?
---
Current Price
$3,414.93, down -18.42 (-0.54%)
---
Analysis Summary
Price Action
The price has recently rejected from a resistance zone (around $3,445–$3,450).
It is currently pulling back, heading downward from this resistance.
Support Zones Highlighted
Multiple horizontal yellow zones mark previous support/resistance levels.
The key immediate support level lies near $3,400–$3,405.
A deeper support area is visible around $3,360–$3,365, and further below near $3,320.
---
Forecast Indication (Based on Markings)
A short-term pullback (blue arrow up) may retest the breakdown level (~$3,430).
Then, a potential drop toward the next support at $3,360 is expected (blue arrow down).
A bearish continuation scenario is emphasized with a red downward arrow, suggesting price may head further down to the $3,320 area if $3,360 fails to hold.
---
Implications for Traders
Bearish Bias: Suggested by the forecast arrows and recent resistance rejection.
Potential Setup:
Short on pullback near $3,430 (if price fails to reclaim this zone).
Target: $3,360 and possibly $3,320.
Stop-loss: Above $3,450 resistance.
---
Would you like a trading plan or signal based on this analysis?
t.me/+EQ88IkMSUvQwMGJk
Join telegram channel free
t.me/+EQ88IkMSUvQwMGJk
Join telegram channel free
t.me/+EQ88IkMSUvQwMGJk
Disclaimer
The information and publications are not meant to be, and do not constitute, financial, investment, trading, or other types of advice or recommendations supplied or endorsed by TradingView. Read more in the Terms of Use.
t.me/+EQ88IkMSUvQwMGJk
Join telegram channel free
t.me/+EQ88IkMSUvQwMGJk
Join telegram channel free
t.me/+EQ88IkMSUvQwMGJk
Disclaimer
The information and publications are not meant to be, and do not constitute, financial, investment, trading, or other types of advice or recommendations supplied or endorsed by TradingView. Read more in the Terms of Use.