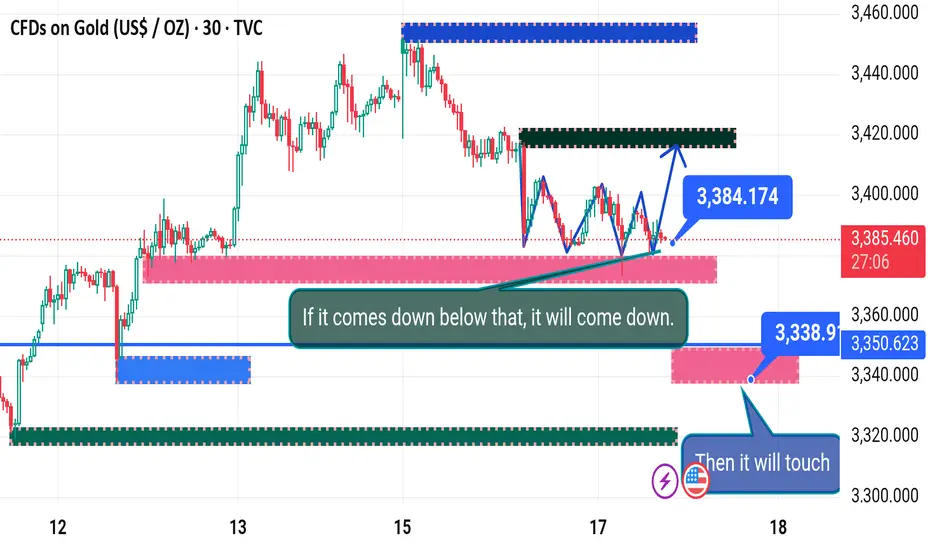
This chart shows a 30-minute timeframe for Gold (TVC:GOLD) with a clear short-term price action analysis. Here's a breakdown:
---
🔍 Key Levels & Zones Identified:
1. Resistance Area:
Around 3,384.174 — marked with a black dashed zone at the top.
Price previously rejected here.
2. Current Price:
3,386.600 (as of 10:56 UTC on June 17, 2025), slightly above the resistance — indicating a potential fakeout or bullish breakout attempt.
3. Support Zone:
Around 3,338.913, highlighted in blue.
The chart notes: "If it comes down below that, it will come down."
Suggests a bearish continuation if price breaks this level.
4. Target Support:
Near 3,325–3,300, green thick band at the bottom.
This is the zone marked "then it will touch", likely the next bearish target.
---
🔁 Pattern Insight:
A triangle or consolidation is forming, shown by blue trend lines — potential breakout or breakdown zone.
If price fails to hold above 3,384.174, it could retest 3,338.913.
A confirmed break below that support opens a move to 3,325 or lower.
---
🧭 Summary:
Bullish Scenario: Hold above 3,384 and break out to retest highs above 3,425.
Bearish Scenario: Drop below 3,338 → target 3,325–3,300 zone.
Let me know if you'd like a trading strategy or confirmation indicators added to this analysis.
---
🔍 Key Levels & Zones Identified:
1. Resistance Area:
Around 3,384.174 — marked with a black dashed zone at the top.
Price previously rejected here.
2. Current Price:
3,386.600 (as of 10:56 UTC on June 17, 2025), slightly above the resistance — indicating a potential fakeout or bullish breakout attempt.
3. Support Zone:
Around 3,338.913, highlighted in blue.
The chart notes: "If it comes down below that, it will come down."
Suggests a bearish continuation if price breaks this level.
4. Target Support:
Near 3,325–3,300, green thick band at the bottom.
This is the zone marked "then it will touch", likely the next bearish target.
---
🔁 Pattern Insight:
A triangle or consolidation is forming, shown by blue trend lines — potential breakout or breakdown zone.
If price fails to hold above 3,384.174, it could retest 3,338.913.
A confirmed break below that support opens a move to 3,325 or lower.
---
🧭 Summary:
Bullish Scenario: Hold above 3,384 and break out to retest highs above 3,425.
Bearish Scenario: Drop below 3,338 → target 3,325–3,300 zone.
Let me know if you'd like a trading strategy or confirmation indicators added to this analysis.
t.me/+EQ88IkMSUvQwMGJk
Join telegram channel free
t.me/+EQ88IkMSUvQwMGJk
Join telegram channel free
t.me/+EQ88IkMSUvQwMGJk
Related publications
Disclaimer
The information and publications are not meant to be, and do not constitute, financial, investment, trading, or other types of advice or recommendations supplied or endorsed by TradingView. Read more in the Terms of Use.
t.me/+EQ88IkMSUvQwMGJk
Join telegram channel free
t.me/+EQ88IkMSUvQwMGJk
Join telegram channel free
t.me/+EQ88IkMSUvQwMGJk
Related publications
Disclaimer
The information and publications are not meant to be, and do not constitute, financial, investment, trading, or other types of advice or recommendations supplied or endorsed by TradingView. Read more in the Terms of Use.