https://tradingview.sweetlogin.com/x/LC6kR2Pi/
💡Message Strategy
During the Asian trading session, gold prices rebounded slightly from $3,320, filling the short gap at the start of the new week. As investors chose to stay on the sidelines before the Fed's two-day monetary policy meeting, the bullish force of the US dollar temporarily weakened, providing support for gold, an interest-free asset.
However, with the 15% tariff agreement between the United States and Europe and the positive progress of trade easing between the United States, Japan and the United States, market risk appetite has rebounded, weakening the appeal of gold as a safe-haven asset.
According to market surveys, "The current optimistic atmosphere of trade has weakened the safe-haven demand for gold, while the weakening of the US dollar has provided support for gold prices. The two forces offset each other, causing gold to fluctuate."
Investors are focusing on the FOMC meeting to be held on Tuesday. Although Trump continues to pressure the Fed to cut interest rates, the market generally expects that the interest rate will remain unchanged at this meeting because the US labor market remains strong.
In addition to the interest rate decision, this week will also usher in the US second quarter GDP estimate, PCE price index and non-farm payrolls report, all of which may have a significant impact on gold.
📊Technical aspects
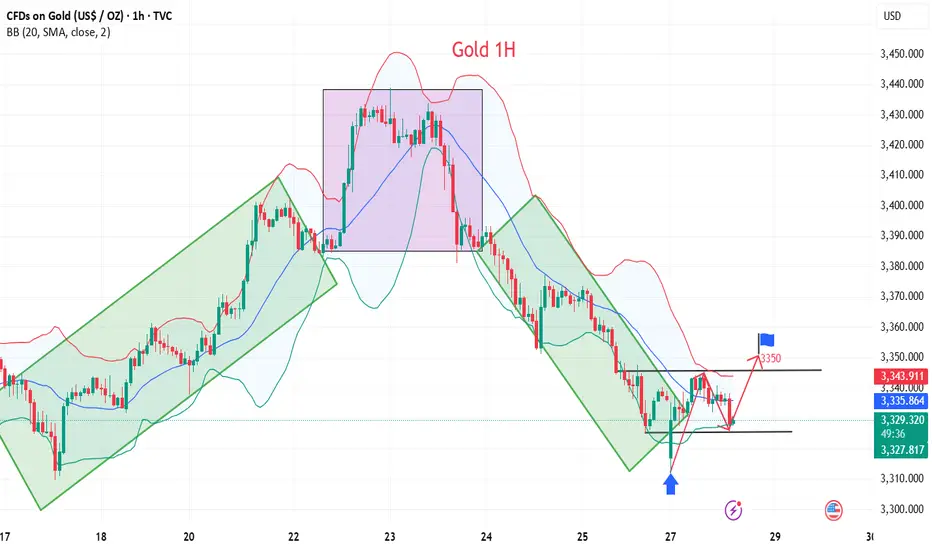
From the technical trend, gold triggered a rapid correction after breaking below the lower edge of the short-term rising channel and the 50% Fibonacci retracement level last week. The current gold price stabilized in the $3,320 area and received some buying at the 61.8% Fibonacci support.
However, it is worth noting that the 200-period moving average on the 4-hour chart is at $3,350, which constitutes an important technical resistance for a short-term rebound. On the contrary, if gold breaks through the $3,350 level, gold will continue to develop a bullish pattern.
From the technical trend, gold triggered a rapid correction after falling below the lower edge of the short-term rising channel and the 50% Fibonacci retracement level last week. The current gold price stabilized in the $3,320 area and received some buying at the 61.8% Fibonacci support.
However, it is worth noting that the 200-period moving average on the 4-hour chart is at $3,350, which constitutes an important technical resistance for a short-term rebound.
On the contrary, if gold breaks through the $3,350 line, it will be expected to attack the $3,371-3,373 area in the short term, and further look to the key pressure levels of $3,400 and $3,440.
💰Strategy Package
Long Position:3320-3325,SL:3300,Target: 3350
💡Message Strategy
During the Asian trading session, gold prices rebounded slightly from $3,320, filling the short gap at the start of the new week. As investors chose to stay on the sidelines before the Fed's two-day monetary policy meeting, the bullish force of the US dollar temporarily weakened, providing support for gold, an interest-free asset.
However, with the 15% tariff agreement between the United States and Europe and the positive progress of trade easing between the United States, Japan and the United States, market risk appetite has rebounded, weakening the appeal of gold as a safe-haven asset.
According to market surveys, "The current optimistic atmosphere of trade has weakened the safe-haven demand for gold, while the weakening of the US dollar has provided support for gold prices. The two forces offset each other, causing gold to fluctuate."
Investors are focusing on the FOMC meeting to be held on Tuesday. Although Trump continues to pressure the Fed to cut interest rates, the market generally expects that the interest rate will remain unchanged at this meeting because the US labor market remains strong.
In addition to the interest rate decision, this week will also usher in the US second quarter GDP estimate, PCE price index and non-farm payrolls report, all of which may have a significant impact on gold.
📊Technical aspects
From the technical trend, gold triggered a rapid correction after breaking below the lower edge of the short-term rising channel and the 50% Fibonacci retracement level last week. The current gold price stabilized in the $3,320 area and received some buying at the 61.8% Fibonacci support.
However, it is worth noting that the 200-period moving average on the 4-hour chart is at $3,350, which constitutes an important technical resistance for a short-term rebound. On the contrary, if gold breaks through the $3,350 level, gold will continue to develop a bullish pattern.
From the technical trend, gold triggered a rapid correction after falling below the lower edge of the short-term rising channel and the 50% Fibonacci retracement level last week. The current gold price stabilized in the $3,320 area and received some buying at the 61.8% Fibonacci support.
However, it is worth noting that the 200-period moving average on the 4-hour chart is at $3,350, which constitutes an important technical resistance for a short-term rebound.
On the contrary, if gold breaks through the $3,350 line, it will be expected to attack the $3,371-3,373 area in the short term, and further look to the key pressure levels of $3,400 and $3,440.
💰Strategy Package
Long Position:3320-3325,SL:3300,Target: 3350
Trade active
The gold market is brewing, waiting for data to develop unilateral strengthThrough scientific and rigorous financial analysis and personalized strategy formulation, we help you achieve stable growth of wealth. At the same time, in a complex and changing economic environment, we help you avoid potential risks and protect the saf
Related publications
Disclaimer
The information and publications are not meant to be, and do not constitute, financial, investment, trading, or other types of advice or recommendations supplied or endorsed by TradingView. Read more in the Terms of Use.
Through scientific and rigorous financial analysis and personalized strategy formulation, we help you achieve stable growth of wealth. At the same time, in a complex and changing economic environment, we help you avoid potential risks and protect the saf
Related publications
Disclaimer
The information and publications are not meant to be, and do not constitute, financial, investment, trading, or other types of advice or recommendations supplied or endorsed by TradingView. Read more in the Terms of Use.