Gold Price Action: Bullish Trend & Key Levels 🟡📈
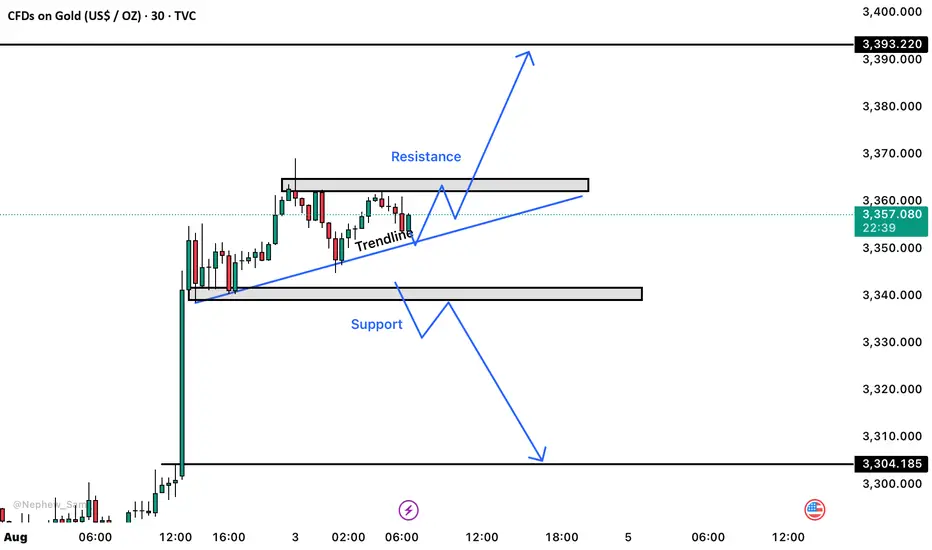
This 30-minute chart provides a clear overview of the current price action for Gold (CFDs), with well-defined support and resistance levels. Let’s break down the key aspects of the chart and the possible trade opportunities. 💹
Key Observations:
📉 Support: The price has been bouncing off the lower boundary at $3,304.185, indicating a strong buying interest in this zone. A solid level to watch for bullish opportunities.
📈 Resistance: At $3,393.220, the price has faced difficulty breaking above, marking a critical sell zone if the price struggles to rise past it.
🔵 Trendline: The upward trendline highlights that price action is making higher lows, signaling a bullish trend overall.
Trade Opportunities:
🔼 Bullish Signal: If the price stays above the trendline and support zone, there’s a strong chance it will test the resistance around $3,393, presenting a potential buy opportunity.
🔽 Bearish Signal: A break below the support level could signal a possible downtrend, with sell opportunities towards the next support at $3,300 or lower.
Trade active
Market break the resistance and now See gold 200 pips Buy area now hold with BE with Good potential Follow my chart for more info
Follow me
Trade closed: target reached
Target achieved gold Likely More Buy trend and follow chart 400 pips Follow my chart for more updates on Gold
Follow me
📊 Market Analysis & Strategy Insights
💷 Focused on Gold & GBP Moves
🎯 Weekly Pip Goals: 1000–1500
🧠 Learn Chart Structures With Us
💼 Account Handling Services
📩 DM to Get Started: t.me/+OTecKlP8871iOTM8
💷 Focused on Gold & GBP Moves
🎯 Weekly Pip Goals: 1000–1500
🧠 Learn Chart Structures With Us
💼 Account Handling Services
📩 DM to Get Started: t.me/+OTecKlP8871iOTM8
Disclaimer
The information and publications are not meant to be, and do not constitute, financial, investment, trading, or other types of advice or recommendations supplied or endorsed by TradingView. Read more in the Terms of Use.