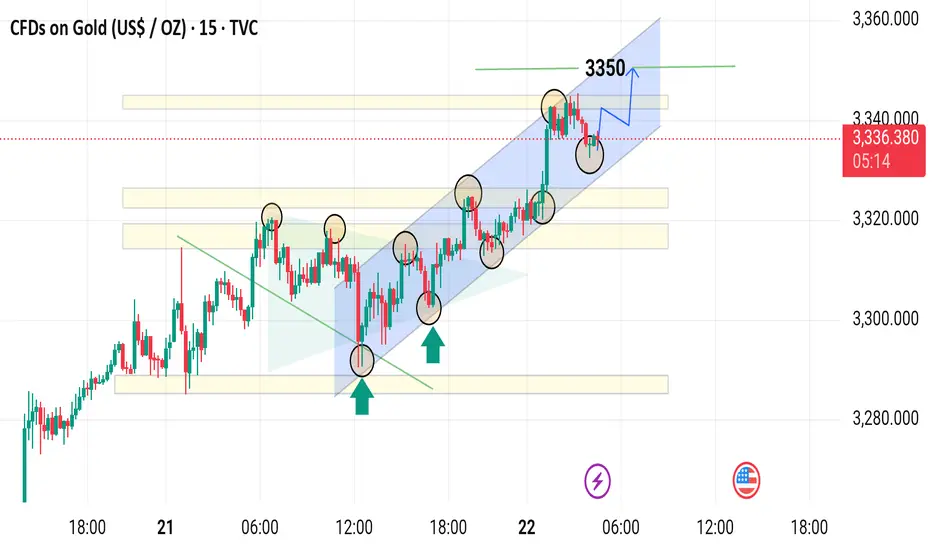
1. Trend Analysis:
Current Trend: Uptrend.
The price is moving within an ascending channel (marked in light blue).
Higher highs and higher lows are visible, indicating bullish momentum.
---
2. Key Support and Resistance Zones:
Support Zones (Yellow boxes):
Several horizontal yellow rectangles show strong historical demand zones.
Price bounced multiple times from these areas (notably marked with green arrows).
Resistance Zones:
Marked by the upper bounds of the channel and horizontal levels.
Around the 3350 mark, the price previously reversed, signaling resistance.
---
3. Candlestick Patterns & Key Points:
Circles around candle highs/lows mark reaction points (resistance rejections and support bounces).
Green Arrows: Indicate strong bullish reversals off support.
The last price shown is 3,335.530, just below the 3350 resistance level.
---
4. Potential Outlook:
A small bullish flag/pennant appears to be forming near the top (shown with a blue arrow).
This may suggest a continuation to the upside if price breaks out above 3350.
Upside target could reach near the 3,355–3,360 area if the breakout confirms.
---
5. Summary & Strategy:
Bullish Bias remains intact while price stays inside the rising channel.
Buy Opportunities: On pullbacks near the lower channel support or breakout above 3350.
Risk Management: Place stop-loss below recent swing lows or the channel bottom.
Trade active
t.me/htGGOLD_SOUK_Trd
🟢All Pairs Signals Provided
🟡XAUUSD AND CRYPTO
✅Just Register now and Enjoy
✅No swap & No commission
one.exnesstrack.org/a/siuhoykv4s
🟢All Pairs Signals Provided
🟡XAUUSD AND CRYPTO
✅Just Register now and Enjoy
✅No swap & No commission
one.exnesstrack.org/a/siuhoykv4s
Disclaimer
The information and publications are not meant to be, and do not constitute, financial, investment, trading, or other types of advice or recommendations supplied or endorsed by TradingView. Read more in the Terms of Use.
