XAU/USD - GOLD/U.S Dollar Technical Analysis Chart Update
Time Frame - M30
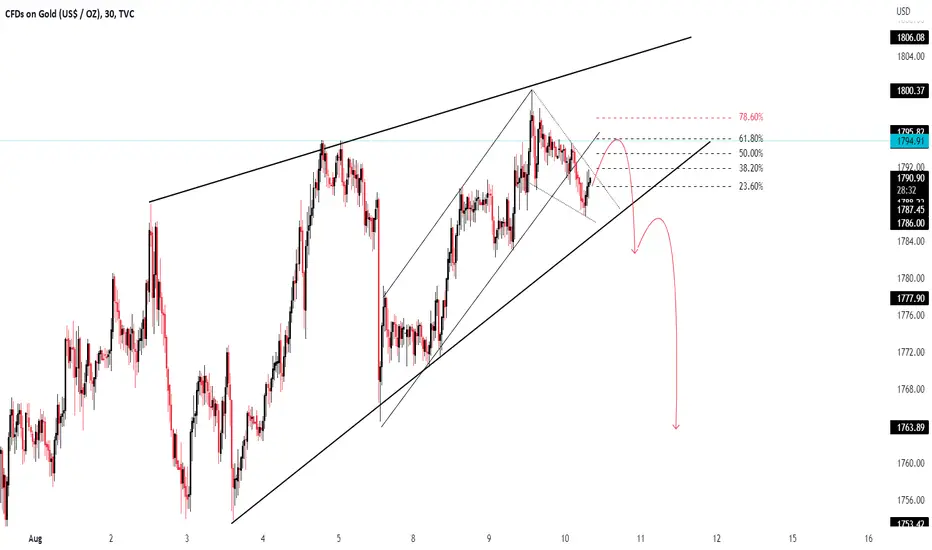
According to Pattern - Rising Wedge it is Rejecting from the Upper Trend Line - UTL
According to Pattern - Bullish Channel it has Breakout and Retested the Lower Trend Line
According to Pattern - Falling Wedge if it breaks the Upper Trend Line - UTL and Retest then we can enter in short term buy till Fibonacci Level - 61.80/78.60%
Its possible that it will Fall from the Strong Level 1794-6
We need strong Bearish Rejection
Time Frame - M30
According to Pattern - Rising Wedge it is Rejecting from the Upper Trend Line - UTL
According to Pattern - Bullish Channel it has Breakout and Retested the Lower Trend Line
According to Pattern - Falling Wedge if it breaks the Upper Trend Line - UTL and Retest then we can enter in short term buy till Fibonacci Level - 61.80/78.60%
Its possible that it will Fall from the Strong Level 1794-6
We need strong Bearish Rejection
Disclaimer
The information and publications are not meant to be, and do not constitute, financial, investment, trading, or other types of advice or recommendations supplied or endorsed by TradingView. Read more in the Terms of Use.
Disclaimer
The information and publications are not meant to be, and do not constitute, financial, investment, trading, or other types of advice or recommendations supplied or endorsed by TradingView. Read more in the Terms of Use.