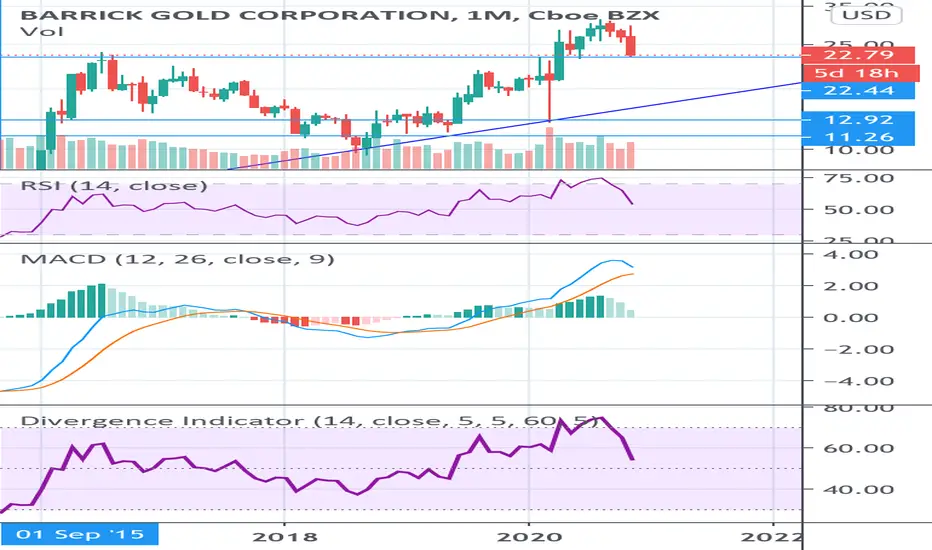
Currently testing the previous horizontal resistance line of the monthly ascending triangle, now as a support line, which I posted about earlier this year. Opening a long position here.hidden bullish divergence also printing on the monthly. However the RSI is more useful on lower timeframes.
Note
Although the price has fallen below the horizontal support line of the top of the triangle, the lower rising support line of the bottom of the triangle should still act as the price floor. I remain long and will buy this support around $18. This is a long term trade, so don’t expect to get rich quick.Related publications
Disclaimer
The information and publications are not meant to be, and do not constitute, financial, investment, trading, or other types of advice or recommendations supplied or endorsed by TradingView. Read more in the Terms of Use.
Related publications
Disclaimer
The information and publications are not meant to be, and do not constitute, financial, investment, trading, or other types of advice or recommendations supplied or endorsed by TradingView. Read more in the Terms of Use.