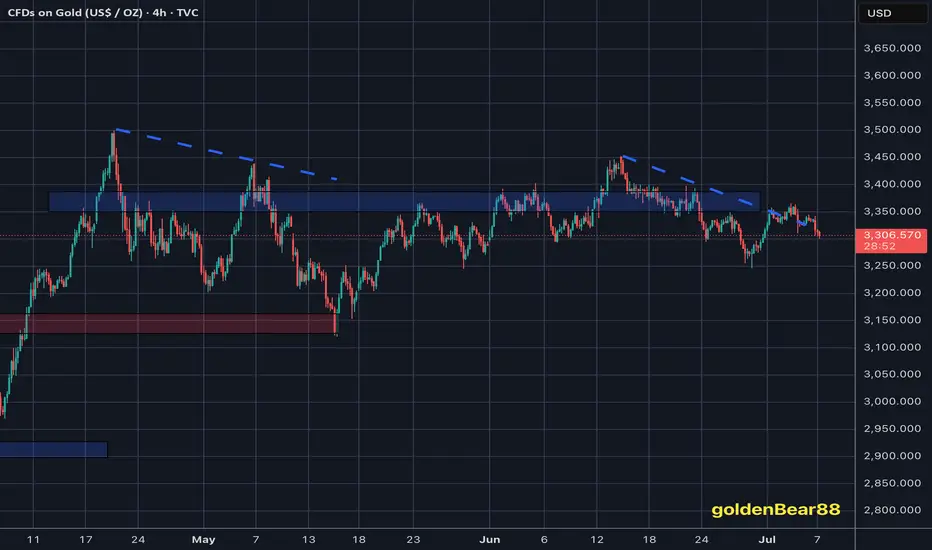
Technical analysis: As expected last week has started off inside my Neutral Rectangle and despite the pullback from the Daily High’s, the (#1W) Weekly chart’s candle was finishing the week at (# +1.79%). As mentioned throughout the week, the last time we had two straight green (#1W), third will follow so expect Bull week (this one) if cycle is replicated. The current pullback on Hourly 4 chart (Engulfing Bearish candlestick formation) has formed an healthy post NFP Descending Channel which is currently on it’s Higher Low’s so the rebound can happen any time. Technically #3,345.80 - #3,348.80 represents the next Lower High’s Lower zone pressure point and that’s why you witnessed many upside rejections there (Gold stalled on mentioned configuration) so Short-term Buyers can Target this level. Remember, #MA50 on Daily chart is line of utmost importance (currently seen Trading at #3,322.80). Price-action still didn’t invalidated the #3,322.80 (with a market closing) Hourly 4 chart’s Support as Gold is picking up the pace towards my expected #3,348.80 - #3,357.80 Resistance zone for the fractal / local High’s.
My position: In my opinion I need to stay on Hourly 4 time-frame for us and the potential break-out to the downside since Hourly 4 chart remains Bearish (never Swing Buy while #H4 is Bearish) on logarithmic scale, hence on limited upside. My expectation is that we still have one (minor) rebound left which will be the final Selling attempt / entry towards #3,300.80 benchmark, if Buyers manage to reverse this, #3,352.80 and #3,400.80 marks are Targets to monitor / which I will pursue with set of Scalp and Swing orders. Trade accordingly as I Bought #3,302.80 with set of aggressive Scalp orders.
My position: In my opinion I need to stay on Hourly 4 time-frame for us and the potential break-out to the downside since Hourly 4 chart remains Bearish (never Swing Buy while #H4 is Bearish) on logarithmic scale, hence on limited upside. My expectation is that we still have one (minor) rebound left which will be the final Selling attempt / entry towards #3,300.80 benchmark, if Buyers manage to reverse this, #3,352.80 and #3,400.80 marks are Targets to monitor / which I will pursue with set of Scalp and Swing orders. Trade accordingly as I Bought #3,302.80 with set of aggressive Scalp orders.
- My official and only Telegram Channel: t.me/goldenBear88
- I do provide professional Gold consulting (signals and financial advice) as well as #1 on #1 mentorship.
- Trading Gold since #2012'.
- I do provide professional Gold consulting (signals and financial advice) as well as #1 on #1 mentorship.
- Trading Gold since #2012'.
Disclaimer
The information and publications are not meant to be, and do not constitute, financial, investment, trading, or other types of advice or recommendations supplied or endorsed by TradingView. Read more in the Terms of Use.