🟡 Key Observations & Technical Elements
1. Price Structure
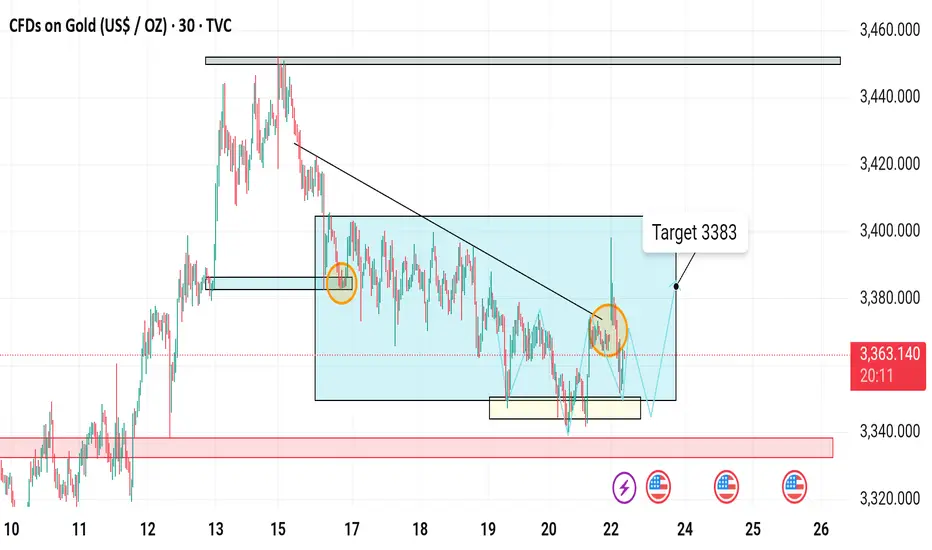
The price has been range-bound within a rectangular blue box.
The range appears to be roughly between 3,340 and 3,400.
There was a previous downtrend indicated by the descending trendline inside the box.
2. Breakout Pattern
Price has broken above the descending trendline within the box (bullish signal).
The breakout seems confirmed by a higher low and higher high structure.
3. Support Zones
A strong support area is highlighted in red below 3,340, showing multiple bounces (demand zone).
Yellow box at the bottom shows a false breakout / liquidity grab before price reversed upward sharply.
4. Target
A target level of 3,383 is clearly marked, suggesting a bullish breakout expectation.
This is consistent with the width of the previous range being projected upward.
5. Indicators
Orange circles highlight key reversal or retest points: one at a resistance-turned-support, and another at a breakout retest.
6. Event Icons
Calendar/event icons (with U.S. flags) below the chart hint at upcoming U.S. economic data releases, likely to bring volatility.
---
📊 Technical Bias: Bullish
Breakout from descending trendline inside range.
Retest successful near 3,350 zone.
Higher lows forming within the range.
Target set at 3,383, slightly below previous highs.
---
📌 Possible Trade Strategy
Entry: After confirmation of breakout and retest (currently done).
Target: 3,383 (as per the setup).
Stop Loss: Below the recent low around 3,345–3,350 zone.
---
⚠️ Risks
The upcoming U.S. data events could invalidate this setup depending on surprises in the releases.
False breakouts are possible in tight consolidation zones like this.
1. Price Structure
The price has been range-bound within a rectangular blue box.
The range appears to be roughly between 3,340 and 3,400.
There was a previous downtrend indicated by the descending trendline inside the box.
2. Breakout Pattern
Price has broken above the descending trendline within the box (bullish signal).
The breakout seems confirmed by a higher low and higher high structure.
3. Support Zones
A strong support area is highlighted in red below 3,340, showing multiple bounces (demand zone).
Yellow box at the bottom shows a false breakout / liquidity grab before price reversed upward sharply.
4. Target
A target level of 3,383 is clearly marked, suggesting a bullish breakout expectation.
This is consistent with the width of the previous range being projected upward.
5. Indicators
Orange circles highlight key reversal or retest points: one at a resistance-turned-support, and another at a breakout retest.
6. Event Icons
Calendar/event icons (with U.S. flags) below the chart hint at upcoming U.S. economic data releases, likely to bring volatility.
---
📊 Technical Bias: Bullish
Breakout from descending trendline inside range.
Retest successful near 3,350 zone.
Higher lows forming within the range.
Target set at 3,383, slightly below previous highs.
---
📌 Possible Trade Strategy
Entry: After confirmation of breakout and retest (currently done).
Target: 3,383 (as per the setup).
Stop Loss: Below the recent low around 3,345–3,350 zone.
---
⚠️ Risks
The upcoming U.S. data events could invalidate this setup depending on surprises in the releases.
False breakouts are possible in tight consolidation zones like this.
Trade active
Trade closed: target reached
🔗 t.me/+VTrdWh5R_scwMGM0
✅ All PAIRS SIGNALS PROVIDE FIRST VISIT THEN JOIN
🔗 t.me/+jODseb0iIvxiNjc0
✅ REGISTER UNDER THE WORLD BEST BROKER
🔗 one.exnesstrack.org/a/6yzdfvn1po
✅ All PAIRS SIGNALS PROVIDE FIRST VISIT THEN JOIN
🔗 t.me/+jODseb0iIvxiNjc0
✅ REGISTER UNDER THE WORLD BEST BROKER
🔗 one.exnesstrack.org/a/6yzdfvn1po
Disclaimer
The information and publications are not meant to be, and do not constitute, financial, investment, trading, or other types of advice or recommendations supplied or endorsed by TradingView. Read more in the Terms of Use.