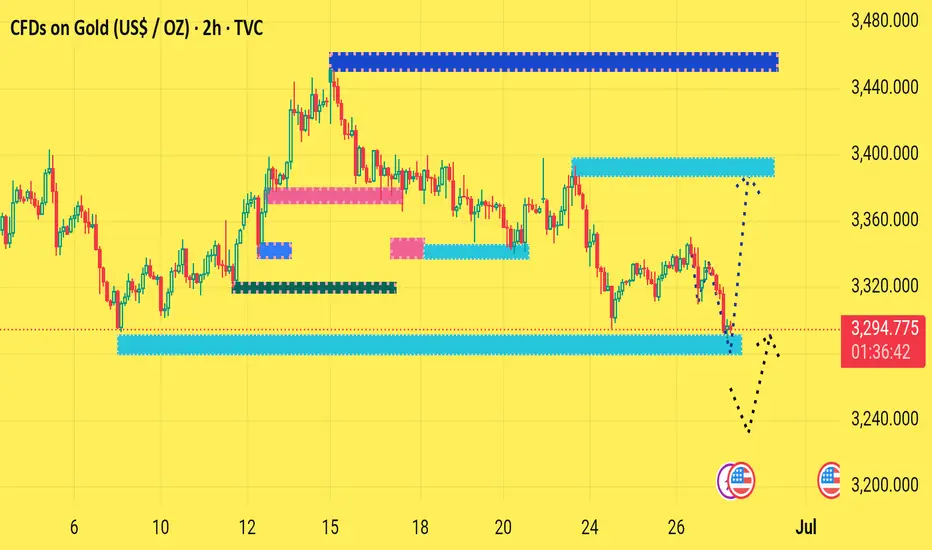
The chart you’ve shared is a 2-hour timeframe for Gold (XAU/USD), showing price action with multiple support and resistance zones along with potential scenarios marked by dotted lines.
Key Technical Observations:
1. Current Price:
$3,294.36, down 1.00%.
2. Support Zones (Blue Boxes):
Major support around $3,230–$3,250 — currently being tested.
This level held previously (mid-June), suggesting it could act as a strong base.
3. Resistance Zones:
Minor resistance near $3,350.
Strong resistance around $3,430–$3,450, marking a previous swing high.
4. Price Scenarios:
Bullish Scenario: If current support holds, price could bounce toward the $3,350 resistance.
Bearish Scenario: A breakdown below current support may lead price toward $3,200, the next major demand zone.
5. Volume Profile Zones (Pink & Blue Highlighted Ranges):
Indicate areas of previous high interest (accumulation/distribution).
Current action near a high-volume node, suggesting potential for either reversal or strong continuation.
---
Summary:
Neutral to Bearish bias unless strong reversal signals appear from the current support.
Watch for bullish confirmation near $3,250–$3,270 to consider long setups.
Breakdown of this zone could trigger a slide to $3,200.
Let me know if you’d like a trading plan or entry/exit levels for either scenario.
t.me/+EQ88IkMSUvQwMGJk
Join telegram channel free
t.me/+EQ88IkMSUvQwMGJk
Join telegram channel free
t.me/+EQ88IkMSUvQwMGJk
Disclaimer
The information and publications are not meant to be, and do not constitute, financial, investment, trading, or other types of advice or recommendations supplied or endorsed by TradingView. Read more in the Terms of Use.
t.me/+EQ88IkMSUvQwMGJk
Join telegram channel free
t.me/+EQ88IkMSUvQwMGJk
Join telegram channel free
t.me/+EQ88IkMSUvQwMGJk
Disclaimer
The information and publications are not meant to be, and do not constitute, financial, investment, trading, or other types of advice or recommendations supplied or endorsed by TradingView. Read more in the Terms of Use.