This chart presents a technical analysis of Gold CFDs (XAU/USD) on the 30-minute timeframe. Here's a breakdown of the key elements:
Chart Structure & Patterns:
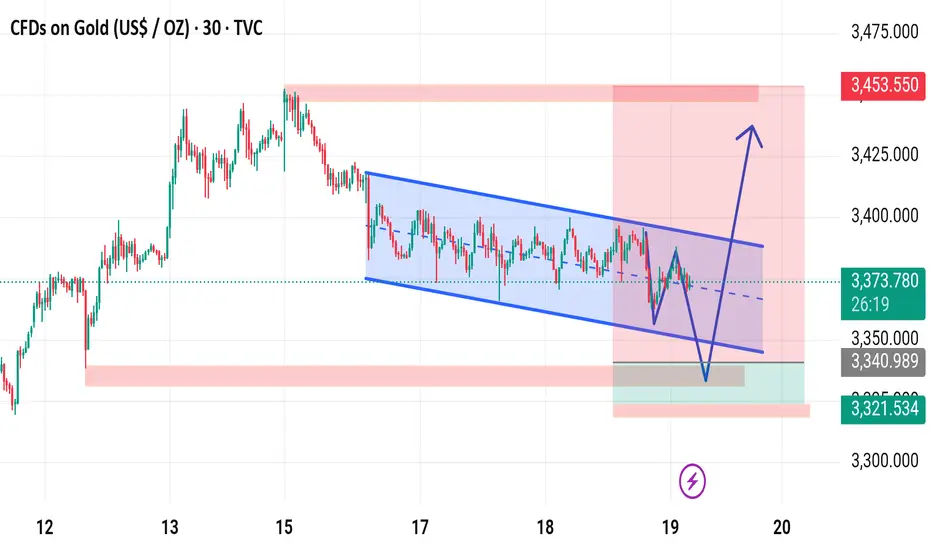
Descending Channel: Price has been consolidating in a downward-sloping channel (marked in blue).
Projected Move: The sketch on the chart shows a potential false breakdown below the channel support, followed by a strong bullish reversal.
Support Zone: Around $3,321.534 to $3,341, highlighted in green/red — this is the expected reversal zone.
Resistance/Target Zone: A sharp upward arrow suggests the price could move towards the $3,453.550 area, the previous high and a key resistance.
Current Price:
$3,373.133 (as per the chart), sitting near the middle of the channel.
Analysis Summary:
This is a bullish setup expecting:
1. A dip to retest or fake out below the channel.
2. Reversal from the demand zone (highlighted green).
3. Breakout from the descending channel leading to a strong rally.
Invalidation likely occurs below $3,321.
Trade Idea (based on the chart):
Buy near: $3,340–$3,325
Stop loss: Below $3,321
Target: $3,440–$3,453
Would you like a written trading plan or risk management breakdown for this idea?
Chart Structure & Patterns:
Descending Channel: Price has been consolidating in a downward-sloping channel (marked in blue).
Projected Move: The sketch on the chart shows a potential false breakdown below the channel support, followed by a strong bullish reversal.
Support Zone: Around $3,321.534 to $3,341, highlighted in green/red — this is the expected reversal zone.
Resistance/Target Zone: A sharp upward arrow suggests the price could move towards the $3,453.550 area, the previous high and a key resistance.
Current Price:
$3,373.133 (as per the chart), sitting near the middle of the channel.
Analysis Summary:
This is a bullish setup expecting:
1. A dip to retest or fake out below the channel.
2. Reversal from the demand zone (highlighted green).
3. Breakout from the descending channel leading to a strong rally.
Invalidation likely occurs below $3,321.
Trade Idea (based on the chart):
Buy near: $3,340–$3,325
Stop loss: Below $3,321
Target: $3,440–$3,453
Would you like a written trading plan or risk management breakdown for this idea?
t.me/+EQ88IkMSUvQwMGJk
Join telegram channel free
t.me/+EQ88IkMSUvQwMGJk
Join telegram channel free
t.me/+EQ88IkMSUvQwMGJk
Disclaimer
The information and publications are not meant to be, and do not constitute, financial, investment, trading, or other types of advice or recommendations supplied or endorsed by TradingView. Read more in the Terms of Use.
t.me/+EQ88IkMSUvQwMGJk
Join telegram channel free
t.me/+EQ88IkMSUvQwMGJk
Join telegram channel free
t.me/+EQ88IkMSUvQwMGJk
Disclaimer
The information and publications are not meant to be, and do not constitute, financial, investment, trading, or other types of advice or recommendations supplied or endorsed by TradingView. Read more in the Terms of Use.