GOLD/USD Bullish Breakout Confirmation 🚀📈
📊 Technical Analysis Overview:
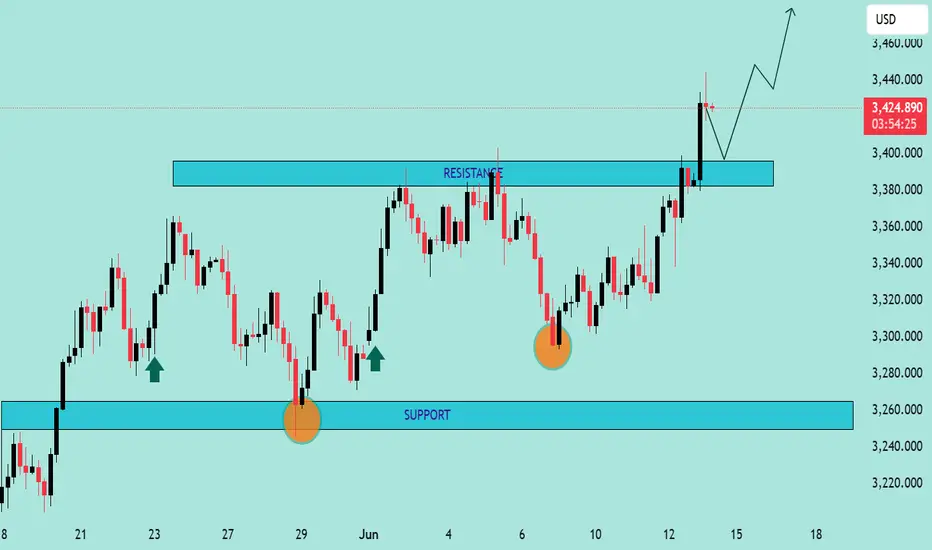
The chart illustrates a bullish breakout above a well-defined resistance zone around $3,390–$3,400. Price action has decisively closed above this resistance, suggesting strong bullish momentum.
🔍 Key Observations:
🟦 Support Zone:
Marked clearly between $3,250–$3,280, this level has held firm multiple times (highlighted with green arrows and orange circles), confirming buyer interest and market structure.
🟦 Resistance Turned Support:
The previous resistance zone around $3,390–$3,400 has now potentially turned into a new support. Price retesting this zone and holding would further validate the breakout.
📈 Future Projections:
The chart anticipates a retest-pullback-continuation scenario:
Pullback to new support 📉
Bullish continuation toward $3,460+ 🎯 if support holds.
✅ Bias:
Bullish as long as price remains above the $3,390 zone. Break and hold below would invalidate the bullish setup.
📌 Strategy Tip:
Look for confirmation on the lower timeframes (e.g., bullish engulfing or pin bar) on the retest before entering long.
📊 Technical Analysis Overview:
The chart illustrates a bullish breakout above a well-defined resistance zone around $3,390–$3,400. Price action has decisively closed above this resistance, suggesting strong bullish momentum.
🔍 Key Observations:
🟦 Support Zone:
Marked clearly between $3,250–$3,280, this level has held firm multiple times (highlighted with green arrows and orange circles), confirming buyer interest and market structure.
🟦 Resistance Turned Support:
The previous resistance zone around $3,390–$3,400 has now potentially turned into a new support. Price retesting this zone and holding would further validate the breakout.
📈 Future Projections:
The chart anticipates a retest-pullback-continuation scenario:
Pullback to new support 📉
Bullish continuation toward $3,460+ 🎯 if support holds.
✅ Bias:
Bullish as long as price remains above the $3,390 zone. Break and hold below would invalidate the bullish setup.
📌 Strategy Tip:
Look for confirmation on the lower timeframes (e.g., bullish engulfing or pin bar) on the retest before entering long.
JOIN MY TELEGRAM CHANNEL
t.me/StellarMarketAnalysis
JOIN MY RECOMMENTED BROKER REFFREL LINK
⤵️one.exnesstrack.net/a/uvd1etcgg1
PARTNER CODE⤵️
uvd1etcgg1
t.me/StellarMarketAnalysis
JOIN MY RECOMMENTED BROKER REFFREL LINK
⤵️one.exnesstrack.net/a/uvd1etcgg1
PARTNER CODE⤵️
uvd1etcgg1
Disclaimer
The information and publications are not meant to be, and do not constitute, financial, investment, trading, or other types of advice or recommendations supplied or endorsed by TradingView. Read more in the Terms of Use.