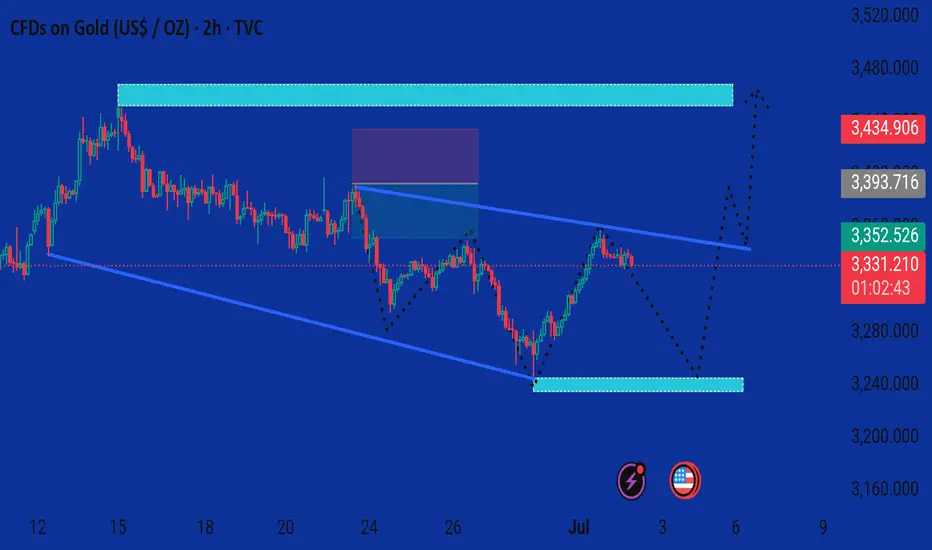
This chart presents a bullish analysis for Gold (CFDs on Gold, 2h timeframe), with the price currently at 3,332.110, showing a slight decline of 0.20%.
Key Observations:
1. Support Zone (~3,250):
A strong demand zone is highlighted near 3,250, where price previously rebounded.
This zone is marked with icons (lightning bolt and U.S. flag), possibly indicating high-impact news or events expected around that area.
2. Current Price Action:
Price recently broke a downtrend line and rallied.
Currently pulling back near the 3,330 level, indicating a potential short-term retracement.
3. Projected Scenarios (Dotted Lines):
Primary Path (Bearish Short-Term → Bullish Mid-Term):
Price may dip back into the 3,250 support zone.
From there, a bullish reversal is anticipated, targeting:
First resistance: ~3,400
Second resistance: ~3,450
4. Resistance Zones:
Two clear supply zones are marked:
~3,400: First target zone after a bounce.
~3,450: Final target zone if bullish momentum continues.
---
Summary:
The chart suggests a potential bullish continuation after a pullback. A retracement to around 3,250 could provide a strong buying opportunity with upside targets near 3,400–3,450, depending on price action and upcoming news catalysts.
Would you like a trading plan based on this setup (e.g., entry, stop-loss, targets)?
t.me/+EQ88IkMSUvQwMGJk
Join telegram channel free
t.me/+EQ88IkMSUvQwMGJk
Join telegram channel free
t.me/+EQ88IkMSUvQwMGJk
Disclaimer
The information and publications are not meant to be, and do not constitute, financial, investment, trading, or other types of advice or recommendations supplied or endorsed by TradingView. Read more in the Terms of Use.
t.me/+EQ88IkMSUvQwMGJk
Join telegram channel free
t.me/+EQ88IkMSUvQwMGJk
Join telegram channel free
t.me/+EQ88IkMSUvQwMGJk
Disclaimer
The information and publications are not meant to be, and do not constitute, financial, investment, trading, or other types of advice or recommendations supplied or endorsed by TradingView. Read more in the Terms of Use.