https://tradingview.sweetlogin.com/x/dmDbHn1t/
💡Message Strategy
Gold prices rose as expected on Friday as a weaker dollar and continued geopolitical and economic uncertainty boosted demand for safe-haven gold. Spot gold rose 0.4% to $3,353.25 an ounce, down 1.1% in the previous session. U.S. gold futures also rose 0.4% to $3,359.70. Gold prices remained largely stable around $3,350 an ounce this week.
The trend of gold prices is currently mainly affected by the following three factors:
1. US economic data supports the US dollar
The latest US real estate data is generally positive, and building permits and new housing starts data are both above expectations. The recovery of the real estate market has reduced market concerns about economic recession, which has provided some support to the US dollar, thereby constituting a certain suppression on gold.
2. Fed policy differences trigger market games
Fed officials have obvious differences in their statements on monetary policy. Christopher Waller, a Fed governor, prefers to directly cut interest rates by 25 basis points in July, worried about economic slowdown and weak job market. San Francisco Fed President Daly believes that two interest rate cuts in 2025 are "reasonable", but is wary of the impact of excessive tightening policies on the job market.
On the contrary, Fed Governor Kugler is more hawkish, believing that recent tariffs have been transmitted to consumer prices, and high interest rates should continue to be maintained, and it is not appropriate to cut interest rates for the time being. The existence of differences has caused market expectations to waver, and gold has fallen into consolidation.
3. Inflation expectations determine the medium-term direction of gold prices
The June CPI data from the United States showed signs of rising inflation, which may cause the Federal Reserve to postpone the pace of interest rate cuts.
📊Technical aspects
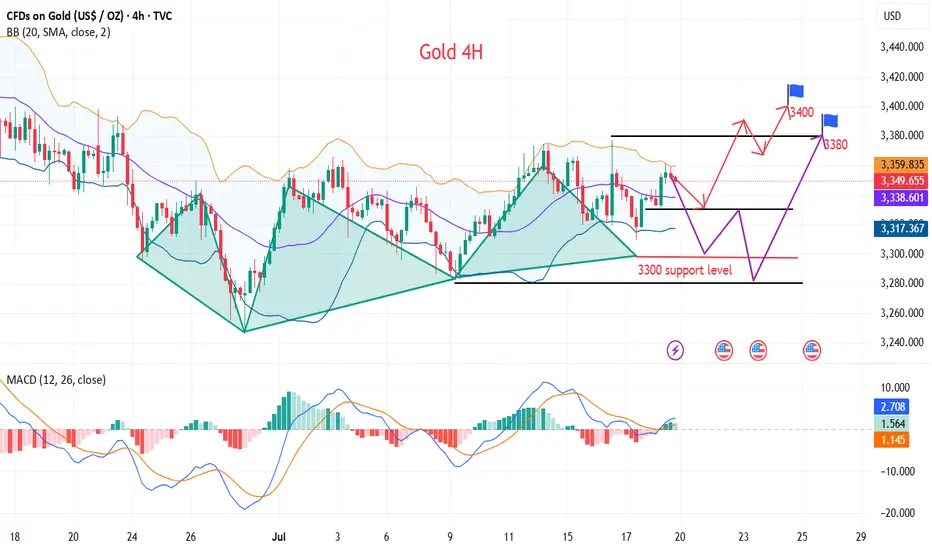
From the 4H chart, gold is currently oscillating in an obvious symmetrical triangle, forming a consolidation pattern in the short term.
Bollinger Band indicator: The middle track of the Bollinger Band is at $3345, the upper track is at $3405, and the lower track is at $3280. The current price is running near the middle track, indicating that volatility is converging and there is an expectation that a direction will be chosen soon.
Support and resistance: The current key support level is $3,280; short-term support is 3,300, and the upper resistance is $3,380. After breaking through, it is expected to test the previous highs of $3,451 and $3,499.
MACD indicator: The MACD histogram is gradually converging, and the DIFF line (3.19) and the DEA line (1.91) are in a sticky state, indicating that the momentum is exhausted and the probability of short-term shocks is high, but once the volume breaks through, the trend may form quickly.
RSI indicator: The RSI indicator is currently at 53.64, which is in the neutral area and has not entered the overbought or oversold area, indicating that the market is still waiting for new direction signals.
Overall, the analysis believes that gold is at the end of a symmetrical triangle, and the technical side shows that it is about to face a breakthrough. The direction choice may appear tonight or early next week, and the idea is still mainly low-level bulls.
💰Strategy Package
Long Position:3320-3330,SL:3300,Target: 3370-80,3400
💡Message Strategy
Gold prices rose as expected on Friday as a weaker dollar and continued geopolitical and economic uncertainty boosted demand for safe-haven gold. Spot gold rose 0.4% to $3,353.25 an ounce, down 1.1% in the previous session. U.S. gold futures also rose 0.4% to $3,359.70. Gold prices remained largely stable around $3,350 an ounce this week.
The trend of gold prices is currently mainly affected by the following three factors:
1. US economic data supports the US dollar
The latest US real estate data is generally positive, and building permits and new housing starts data are both above expectations. The recovery of the real estate market has reduced market concerns about economic recession, which has provided some support to the US dollar, thereby constituting a certain suppression on gold.
2. Fed policy differences trigger market games
Fed officials have obvious differences in their statements on monetary policy. Christopher Waller, a Fed governor, prefers to directly cut interest rates by 25 basis points in July, worried about economic slowdown and weak job market. San Francisco Fed President Daly believes that two interest rate cuts in 2025 are "reasonable", but is wary of the impact of excessive tightening policies on the job market.
On the contrary, Fed Governor Kugler is more hawkish, believing that recent tariffs have been transmitted to consumer prices, and high interest rates should continue to be maintained, and it is not appropriate to cut interest rates for the time being. The existence of differences has caused market expectations to waver, and gold has fallen into consolidation.
3. Inflation expectations determine the medium-term direction of gold prices
The June CPI data from the United States showed signs of rising inflation, which may cause the Federal Reserve to postpone the pace of interest rate cuts.
📊Technical aspects
From the 4H chart, gold is currently oscillating in an obvious symmetrical triangle, forming a consolidation pattern in the short term.
Bollinger Band indicator: The middle track of the Bollinger Band is at $3345, the upper track is at $3405, and the lower track is at $3280. The current price is running near the middle track, indicating that volatility is converging and there is an expectation that a direction will be chosen soon.
Support and resistance: The current key support level is $3,280; short-term support is 3,300, and the upper resistance is $3,380. After breaking through, it is expected to test the previous highs of $3,451 and $3,499.
MACD indicator: The MACD histogram is gradually converging, and the DIFF line (3.19) and the DEA line (1.91) are in a sticky state, indicating that the momentum is exhausted and the probability of short-term shocks is high, but once the volume breaks through, the trend may form quickly.
RSI indicator: The RSI indicator is currently at 53.64, which is in the neutral area and has not entered the overbought or oversold area, indicating that the market is still waiting for new direction signals.
Overall, the analysis believes that gold is at the end of a symmetrical triangle, and the technical side shows that it is about to face a breakthrough. The direction choice may appear tonight or early next week, and the idea is still mainly low-level bulls.
💰Strategy Package
Long Position:3320-3330,SL:3300,Target: 3370-80,3400
Trade active
Safe-haven demand helps gold prices hold the 3,350 mark. Next week, the focus will be on tariff games and the Fed's personnel turmoilTrade closed: target reached
Gold reaches the first target profit pointThrough scientific and rigorous financial analysis and personalized strategy formulation, we help you achieve stable growth of wealth. At the same time, in a complex and changing economic environment, we help you avoid potential risks and protect the saf
Related publications
Disclaimer
The information and publications are not meant to be, and do not constitute, financial, investment, trading, or other types of advice or recommendations supplied or endorsed by TradingView. Read more in the Terms of Use.
Through scientific and rigorous financial analysis and personalized strategy formulation, we help you achieve stable growth of wealth. At the same time, in a complex and changing economic environment, we help you avoid potential risks and protect the saf
Related publications
Disclaimer
The information and publications are not meant to be, and do not constitute, financial, investment, trading, or other types of advice or recommendations supplied or endorsed by TradingView. Read more in the Terms of Use.