🔍 Original Analysis Summary:
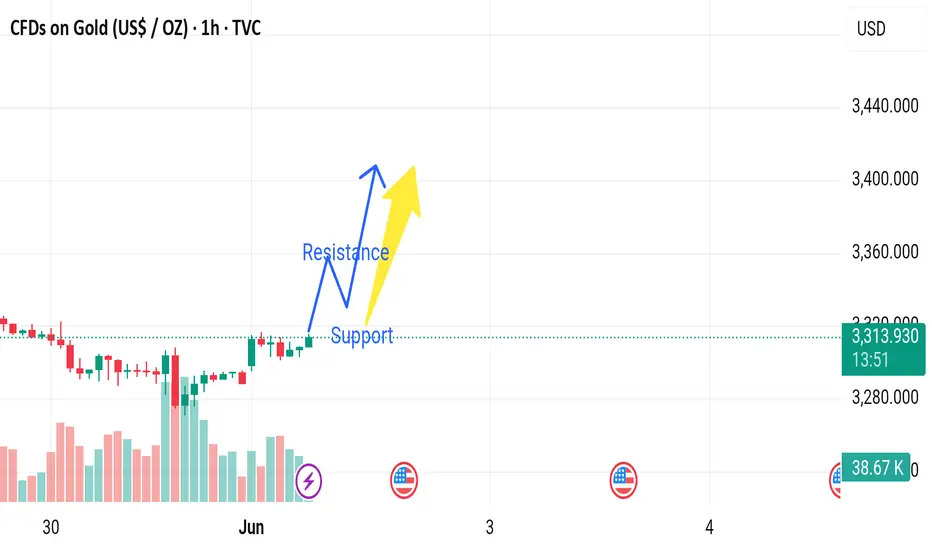
Bullish Bias: The analysis suggests a breakout above the current level, with price bouncing off "support" and targeting higher levels beyond the marked "resistance."
Expectation: Higher highs post-breakout.
---
⚠️ Disruption (Bearish/Neutral Counter-View):
1. Low Volume on Recent Push
Recent bullish candles have declining volume, signaling potential weak buying pressure.
This divergence could imply that buyers are losing interest or that the rally is unsustainable.
2. Flat Resistance Zone
The price is struggling to break above the 3,315–3,320 level, suggesting strong selling pressure.
Multiple rejections at the same level could form a double top, a bearish reversal pattern.
3. Lower Highs from May 30 Peak
While the price is rising, it's still below the highs made on May 30, indicating the uptrend might be weakening.
4. Bearish Divergence (Hypothetical)
If RSI or MACD were plotted, a bearish divergence (price rising, but momentum indicators falling) might be present — often a precursor to a reversal.
5. Fundamental Risk: U.S. Data (Flagged)
The U.S. flag icon signals upcoming economic news. If positive, it could strengthen the USD, pushing gold lower.
Volatility around this time might invalidate the bullish setup.
Disclaimer
The information and publications are not meant to be, and do not constitute, financial, investment, trading, or other types of advice or recommendations supplied or endorsed by TradingView. Read more in the Terms of Use.
Disclaimer
The information and publications are not meant to be, and do not constitute, financial, investment, trading, or other types of advice or recommendations supplied or endorsed by TradingView. Read more in the Terms of Use.