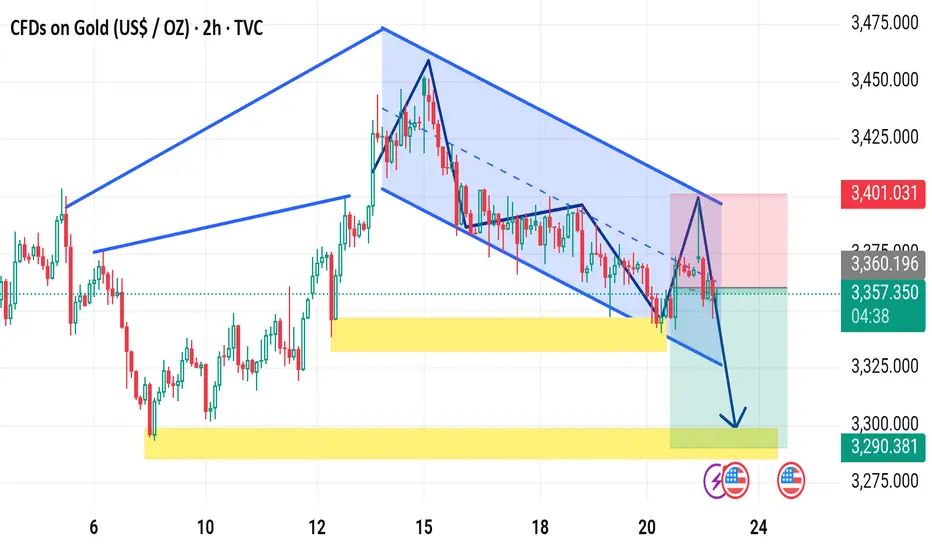
The chart you've shared is a 2-hour price chart for CFDs on Gold (US$/OZ) and presents a bearish setup. Here's a detailed breakdown of the analysis:
---
📉 Pattern Overview:
The price is currently moving within a descending channel (highlighted in blue).
A bearish flag or descending parallel channel is clearly visible, indicating continuation to the downside.
There is a clear lower high and lower low structure, reinforcing the bearish sentiment.
---
⚠️ Key Zones:
Yellow zones mark key support levels.
First support zone around 3,320 (minor support).
Second, stronger support zone around 3,290.
The upper red box (near 3,401) indicates a stop-loss region.
The green box shows a take-profit target area, aligned with the support.
---
📊 Trade Setup Indicated:
Entry: Around current price (~3,357).
Stop-loss: ~3,401 (above the recent high).
Take-profit: ~3,290 zone (support zone below).
Risk-to-reward ratio (R:R): Favorable, likely around 1:2 or more.
---
🔔 Fundamental Overlay:
Icons at the bottom (flags and lightning bolt) show upcoming U.S. economic events, which could add volatility and may impact gold price action — something to watch closely before entering.
---
✅ Summary:
This is a bearish trade setup expecting a breakdown from the channel and a move toward the 3,290 support. It’s a technically sound setup assuming no major reversal catalyst from the U.S. economic events shown.
Would you like an updated version with live prices or to run a backtest on this pattern?
---
📉 Pattern Overview:
The price is currently moving within a descending channel (highlighted in blue).
A bearish flag or descending parallel channel is clearly visible, indicating continuation to the downside.
There is a clear lower high and lower low structure, reinforcing the bearish sentiment.
---
⚠️ Key Zones:
Yellow zones mark key support levels.
First support zone around 3,320 (minor support).
Second, stronger support zone around 3,290.
The upper red box (near 3,401) indicates a stop-loss region.
The green box shows a take-profit target area, aligned with the support.
---
📊 Trade Setup Indicated:
Entry: Around current price (~3,357).
Stop-loss: ~3,401 (above the recent high).
Take-profit: ~3,290 zone (support zone below).
Risk-to-reward ratio (R:R): Favorable, likely around 1:2 or more.
---
🔔 Fundamental Overlay:
Icons at the bottom (flags and lightning bolt) show upcoming U.S. economic events, which could add volatility and may impact gold price action — something to watch closely before entering.
---
✅ Summary:
This is a bearish trade setup expecting a breakdown from the channel and a move toward the 3,290 support. It’s a technically sound setup assuming no major reversal catalyst from the U.S. economic events shown.
Would you like an updated version with live prices or to run a backtest on this pattern?
t.me/+EQ88IkMSUvQwMGJk
Join telegram channel free
t.me/+EQ88IkMSUvQwMGJk
Join telegram channel free
t.me/+EQ88IkMSUvQwMGJk
Disclaimer
The information and publications are not meant to be, and do not constitute, financial, investment, trading, or other types of advice or recommendations supplied or endorsed by TradingView. Read more in the Terms of Use.
t.me/+EQ88IkMSUvQwMGJk
Join telegram channel free
t.me/+EQ88IkMSUvQwMGJk
Join telegram channel free
t.me/+EQ88IkMSUvQwMGJk
Disclaimer
The information and publications are not meant to be, and do not constitute, financial, investment, trading, or other types of advice or recommendations supplied or endorsed by TradingView. Read more in the Terms of Use.