Bullish Reversal Setup on GOLD/USD 💰📈
🔍 Chart Analysis:
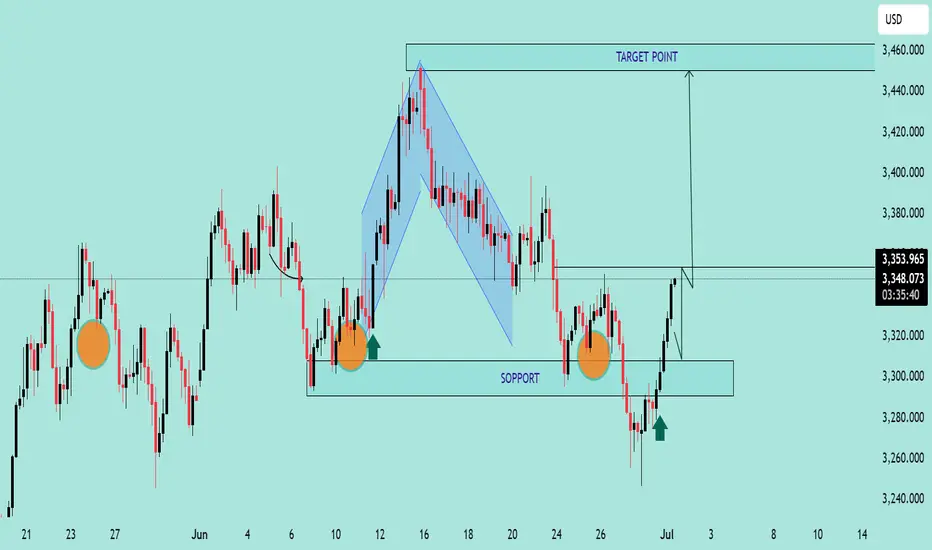
The chart illustrates a clear bullish reversal structure forming off a strong support zone:
📌 Key Observations:
Multiple Rejections at Support 🟠
The price has reacted to the 3,300 - 3,280 USD support zone multiple times, forming a triple bottom pattern, indicating strong buyer interest.
Bullish Harmonic Pattern ✅
A bullish harmonic pattern (likely a Bat or Gartley) completed right at the support level, triggering a strong reversal with a bullish engulfing candle.
Break of Minor Structure 📊
Price broke through minor resistance near 3,340 USD, confirming bullish momentum. The breakout is supported by a retest shown with the green arrow 🟢.
Target Point Identified 🎯
The projected target is 3,460 USD, marked clearly as the next significant resistance zone. This aligns with previous price rejection areas, making it a high-probability target.
📈 Trading Outlook:
✅ Buy Confirmation: Break and retest of 3,340 USD zone.
🎯 Target: 3,460 USD.
🛡️ Support Zone: 3,300 – 3,280 USD (watch for any breakdown below this).
📌 Conclusion:
The chart signals a high-probability bullish continuation, with strong support, harmonic confluence, and structural breakout. Traders may look for buy opportunities on pullbacks with the target set at 3,460 USD. 🚀📊
🔍 Chart Analysis:
The chart illustrates a clear bullish reversal structure forming off a strong support zone:
📌 Key Observations:
Multiple Rejections at Support 🟠
The price has reacted to the 3,300 - 3,280 USD support zone multiple times, forming a triple bottom pattern, indicating strong buyer interest.
Bullish Harmonic Pattern ✅
A bullish harmonic pattern (likely a Bat or Gartley) completed right at the support level, triggering a strong reversal with a bullish engulfing candle.
Break of Minor Structure 📊
Price broke through minor resistance near 3,340 USD, confirming bullish momentum. The breakout is supported by a retest shown with the green arrow 🟢.
Target Point Identified 🎯
The projected target is 3,460 USD, marked clearly as the next significant resistance zone. This aligns with previous price rejection areas, making it a high-probability target.
📈 Trading Outlook:
✅ Buy Confirmation: Break and retest of 3,340 USD zone.
🎯 Target: 3,460 USD.
🛡️ Support Zone: 3,300 – 3,280 USD (watch for any breakdown below this).
📌 Conclusion:
The chart signals a high-probability bullish continuation, with strong support, harmonic confluence, and structural breakout. Traders may look for buy opportunities on pullbacks with the target set at 3,460 USD. 🚀📊
JOIN MY TELEGRAM CHANNEL
t.me/StellarMarketAnalysis
JOIN MY RECOMMENTED BROKER REFFREL LINK
⤵️one.exnesstrack.net/a/uvd1etcgg1
PARTNER CODE⤵️
uvd1etcgg1
t.me/StellarMarketAnalysis
JOIN MY RECOMMENTED BROKER REFFREL LINK
⤵️one.exnesstrack.net/a/uvd1etcgg1
PARTNER CODE⤵️
uvd1etcgg1
Disclaimer
The information and publications are not meant to be, and do not constitute, financial, investment, trading, or other types of advice or recommendations supplied or endorsed by TradingView. Read more in the Terms of Use.