Market news:
In the early Asian session on Wednesday (April 2), spot gold fluctuated in a narrow range and is currently trading around $3,130/ounce. The London gold price rose and fell on Tuesday. Spot gold rose to around the 3,150 mark earlier, and suddenly fell sharply after hitting a record high, falling nearly $50 from the high point. This is mainly attributed to investors choosing to take profits before US President Trump announced a series of tariffs. International gold has traditionally been a safe-haven asset in times of geopolitical and economic uncertainty. On Monday, the international gold price ended the first quarter with the strongest single-quarter performance since 1986, closing above $3,100/ounce. This is one of the most volatile periods in gold history. This trading day will also release the US ADP employment changes in March and the US factory orders monthly rate in February. Federal Reserve Board member Kugler will also deliver a speech, which investors need to pay attention to. In addition, it is necessary to focus on the details of the reciprocal tariffs and industry-specific tariffs announced by US President Trump, and be wary of the "boots landing" market.
Technical Review:
Gold ended its consecutive positive structure, and the daily chart closed with a long upper shadow and a negative K-line, and fell back to 3100 in the late trading. Technically, the gold price is still above the MA7 and 5-day moving averages at 3078/95, while the MA10/7-day moving averages still remain open upward, and the price is running on the upper track of the Bollinger Band.The short-term four-hour moving average closed, and the price was running below the MA10-day moving average at 3123. The price retreated to the middle track of the Bollinger Band at 3101/04. The RSI indicator turned downward after touching the overbought value above 80 yesterday. The hourly moving averages are glued together, and the price returns to the middle and lower tracks of the Bollinger Band. Gold is expected to continue to expand its volatility adjustment range during the day. It is recommended to wait for a correction before buying low and be cautious in chasing long positions at historical highs. Key resistance levels or historical highs participate in high-altitude coordination. Once the special tariff policy is implemented, there is a high probability that the situation of buying expectations and selling facts will occur. Pay attention to the sharp decline in the gold and silver market prices. On the contrary, if the new tariff policy is announced on the basis of the original tariff policy, gold needs to pay attention again to trigger risk aversion and usher in a sharp rise or set a new record high again.
Today's analysis:
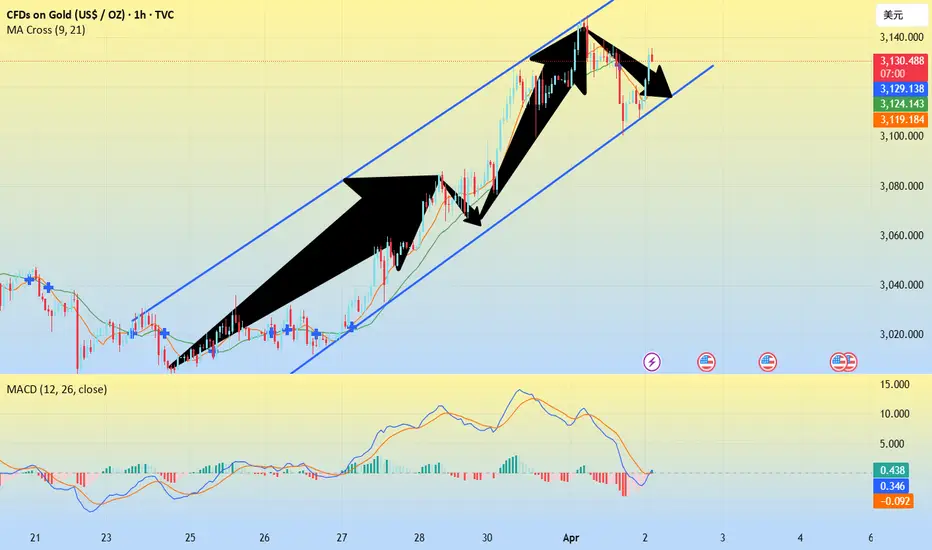
Gold rose and fell back in the US market yesterday, and the bulls may enter an adjustment cycle under short-term pressure. In the short term, gold is expected to adjust! Yesterday, gold rose first and then fell, rising to 3148 before falling and adjusting. The European market fluctuated narrowly. From the technical indicators, the 2-hour moving average has formed a dead cross, MACD dead cross and large volume, Bollinger band closed, and the US market continued to decline after the shock. It has now fallen below the 3120 intraday watershed. In the short term, it means that the bulls have temporarily come to an end and started to retreat and adjust. From the 1-hour chart of gold, the rising volume at the tail end of the wave is usually not sustainable, accompanied by a step-by-step wash-out. After yesterday's retracement, today's Asian session quickly rose and rushed high, accompanied by a big negative line in the hourly chart, and retreated to the local high of 3150. The fluctuation base is large and the adjustment space can be large or small. It is not easy to chase high at the current position. Although short selling is against the trend, the technical overbought tariff implementation will also be realized, and the adjustment space should not be underestimated. Ultra-short-term combined with medium and long-term shorts to deal with short-term short adjustments.
Operation ideas:
Buy short-term gold at 3110-3113, stop loss at 3102, target at 3140-3150;
Sell short-term gold at 3143-3145, stop loss at 3154, target at 3120-3110;
Key points:
First support level: 3115, second support level: 3102, third support level: 3093
First resistance level: 3130, second resistance level: 3138, third resistance level: 3150
In the early Asian session on Wednesday (April 2), spot gold fluctuated in a narrow range and is currently trading around $3,130/ounce. The London gold price rose and fell on Tuesday. Spot gold rose to around the 3,150 mark earlier, and suddenly fell sharply after hitting a record high, falling nearly $50 from the high point. This is mainly attributed to investors choosing to take profits before US President Trump announced a series of tariffs. International gold has traditionally been a safe-haven asset in times of geopolitical and economic uncertainty. On Monday, the international gold price ended the first quarter with the strongest single-quarter performance since 1986, closing above $3,100/ounce. This is one of the most volatile periods in gold history. This trading day will also release the US ADP employment changes in March and the US factory orders monthly rate in February. Federal Reserve Board member Kugler will also deliver a speech, which investors need to pay attention to. In addition, it is necessary to focus on the details of the reciprocal tariffs and industry-specific tariffs announced by US President Trump, and be wary of the "boots landing" market.
Technical Review:
Gold ended its consecutive positive structure, and the daily chart closed with a long upper shadow and a negative K-line, and fell back to 3100 in the late trading. Technically, the gold price is still above the MA7 and 5-day moving averages at 3078/95, while the MA10/7-day moving averages still remain open upward, and the price is running on the upper track of the Bollinger Band.The short-term four-hour moving average closed, and the price was running below the MA10-day moving average at 3123. The price retreated to the middle track of the Bollinger Band at 3101/04. The RSI indicator turned downward after touching the overbought value above 80 yesterday. The hourly moving averages are glued together, and the price returns to the middle and lower tracks of the Bollinger Band. Gold is expected to continue to expand its volatility adjustment range during the day. It is recommended to wait for a correction before buying low and be cautious in chasing long positions at historical highs. Key resistance levels or historical highs participate in high-altitude coordination. Once the special tariff policy is implemented, there is a high probability that the situation of buying expectations and selling facts will occur. Pay attention to the sharp decline in the gold and silver market prices. On the contrary, if the new tariff policy is announced on the basis of the original tariff policy, gold needs to pay attention again to trigger risk aversion and usher in a sharp rise or set a new record high again.
Today's analysis:
Gold rose and fell back in the US market yesterday, and the bulls may enter an adjustment cycle under short-term pressure. In the short term, gold is expected to adjust! Yesterday, gold rose first and then fell, rising to 3148 before falling and adjusting. The European market fluctuated narrowly. From the technical indicators, the 2-hour moving average has formed a dead cross, MACD dead cross and large volume, Bollinger band closed, and the US market continued to decline after the shock. It has now fallen below the 3120 intraday watershed. In the short term, it means that the bulls have temporarily come to an end and started to retreat and adjust. From the 1-hour chart of gold, the rising volume at the tail end of the wave is usually not sustainable, accompanied by a step-by-step wash-out. After yesterday's retracement, today's Asian session quickly rose and rushed high, accompanied by a big negative line in the hourly chart, and retreated to the local high of 3150. The fluctuation base is large and the adjustment space can be large or small. It is not easy to chase high at the current position. Although short selling is against the trend, the technical overbought tariff implementation will also be realized, and the adjustment space should not be underestimated. Ultra-short-term combined with medium and long-term shorts to deal with short-term short adjustments.
Operation ideas:
Buy short-term gold at 3110-3113, stop loss at 3102, target at 3140-3150;
Sell short-term gold at 3143-3145, stop loss at 3154, target at 3120-3110;
Key points:
First support level: 3115, second support level: 3102, third support level: 3093
First resistance level: 3130, second resistance level: 3138, third resistance level: 3150
Disclaimer
The information and publications are not meant to be, and do not constitute, financial, investment, trading, or other types of advice or recommendations supplied or endorsed by TradingView. Read more in the Terms of Use.
Disclaimer
The information and publications are not meant to be, and do not constitute, financial, investment, trading, or other types of advice or recommendations supplied or endorsed by TradingView. Read more in the Terms of Use.