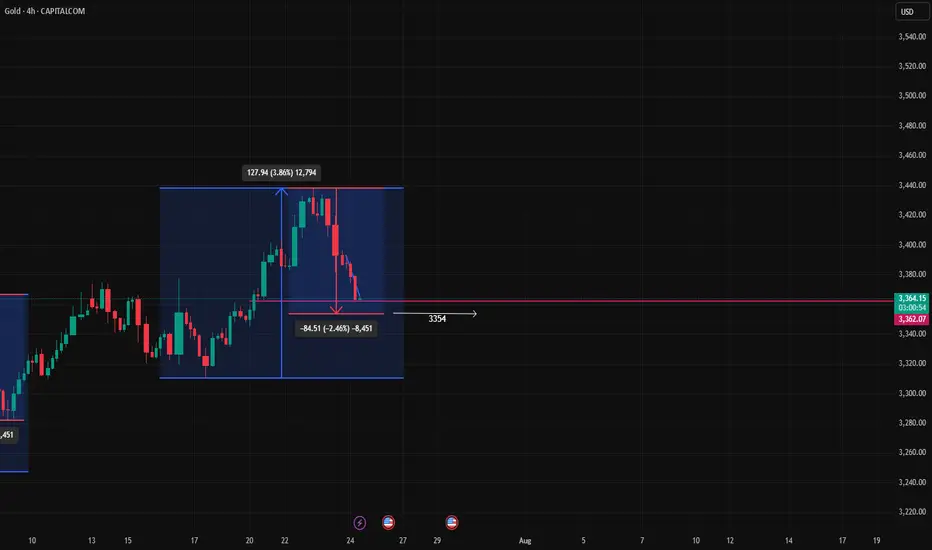
This **4-hour Gold (XAU/USD)** chart shows a classic **price action structure** with two major impulsive waves followed by corrective pullbacks. Here's a breakdown using **price action principles**:
🔹 **1. Impulsive Rally #1 (Left Box)**
* **Price surged** by approx. **119.55 points (+3.68%)**, forming strong bullish candles with little to no wick on top — a sign of **buyer dominance**.
* The move was sharp, indicating **strong momentum** and **break of previous lower highs**, suggesting a possible **market structure shift** to bullish.
🔻 **2. Correction #1**
* The rally was followed by a **retracement of -84.51 points (-2.51%)**.
* Price made **lower highs and lower lows** within this box — indicating a **corrective pullback**, not a reversal.
* It respected previous support zones, which shows **buyers still in control**.
### 🔹 **3. Impulsive Rally #2 (Right Box)**
* Price then made a **new higher high**, rising **127.94 points (+3.86%)**.
* Strong bullish candles again appeared with follow-through — confirming **bullish order flow**.
* The **break of the previous swing high** confirms a **bullish structure continuation**.
### 🔻 **4. Correction #2 (Ongoing)**
* Current price is in a **retracement phase** of around **-84.51 points (-2.46%)** — nearly identical in size to the first correction.
* The correction is forming **lower highs and lower lows**, with potential for **bullish reaction near the previous support or demand zone**.
* The **market is testing previous structure** (support level near \$3360–\$3370) — a key area for **bullish reversal confirmation** (watch for pin bars or bullish engulfing patterns).
📌 **Price Action Summary
* **Structure**: Higher highs, higher lows — confirms **uptrend**.
* **Corrections**: Controlled and proportional — shows **healthy trend**.
* **Current Zone**: Price is testing **potential support**, watch for **bullish reversal signals** to catch next wave.
* **Bias**: Still **bullish**, unless structure breaks below recent swing low (\~\$3340).
---
✅ Traders’ Tip**: If bullish candles form at current support, it may present a **buy opportunity** with targets toward recent highs. Use proper risk management and watch for confirmation!
Disclaimer
The information and publications are not meant to be, and do not constitute, financial, investment, trading, or other types of advice or recommendations supplied or endorsed by TradingView. Read more in the Terms of Use.
Disclaimer
The information and publications are not meant to be, and do not constitute, financial, investment, trading, or other types of advice or recommendations supplied or endorsed by TradingView. Read more in the Terms of Use.