SMC trading point update
Technical analysis of Gold (XAU/USD) on the 30-minute timeframe, based on technical signals and price action behavior. Here's the breakdown
---
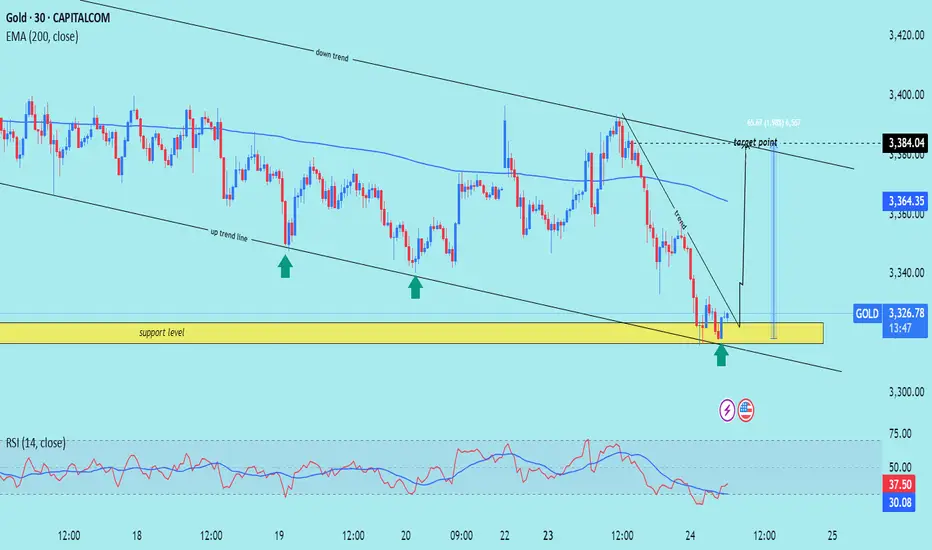
Gold Bullish Reversal Setup – Targeting 3,384
---
Key Technical Highlights:
1. Support Zone & Price Reaction:
Price has tested a strong horizontal support level (highlighted in yellow).
Multiple bullish rejection wicks indicate buying pressure at this zone.
The green arrows show successful support bounces, hinting at bullish intent.
2. Trendline Analysis:
Price bounced near the lower boundary of the falling wedge/downtrend channel.
An uptrend line convergence supports potential reversal.
A breakout above the short-term descending trendline is indicated.
3. EMA & Target Projection:
EMA 200 at 3,364.33 may act as dynamic resistance, the next short-term hurdle.
Target zone projected at 3,384.04, offering a potential move of +65.67 pts (~1.98%).
4. RSI Indicator:
RSI(14) is oversold (~29.93), signaling a potential reversal.
A bullish crossover may be forming, supporting upward momentum.
---
Trading Plan:
Entry Zone: Near current support area around 3,325
Target: 3,384
Stop Loss (Suggested): Below 3,300, under support structure
Risk/Reward: Favorable based on support hold and breakout projection
Mr SMC Trading point
---
Conclusion:
This setup suggests a short-term bullish reversal from a key support area, with confirmation likely if price breaks above the descending trendline and clears the 200 EMA.
Please support boost 🚀 this analysis)
Technical analysis of Gold (XAU/USD) on the 30-minute timeframe, based on technical signals and price action behavior. Here's the breakdown
---
Gold Bullish Reversal Setup – Targeting 3,384
---
Key Technical Highlights:
1. Support Zone & Price Reaction:
Price has tested a strong horizontal support level (highlighted in yellow).
Multiple bullish rejection wicks indicate buying pressure at this zone.
The green arrows show successful support bounces, hinting at bullish intent.
2. Trendline Analysis:
Price bounced near the lower boundary of the falling wedge/downtrend channel.
An uptrend line convergence supports potential reversal.
A breakout above the short-term descending trendline is indicated.
3. EMA & Target Projection:
EMA 200 at 3,364.33 may act as dynamic resistance, the next short-term hurdle.
Target zone projected at 3,384.04, offering a potential move of +65.67 pts (~1.98%).
4. RSI Indicator:
RSI(14) is oversold (~29.93), signaling a potential reversal.
A bullish crossover may be forming, supporting upward momentum.
---
Trading Plan:
Entry Zone: Near current support area around 3,325
Target: 3,384
Stop Loss (Suggested): Below 3,300, under support structure
Risk/Reward: Favorable based on support hold and breakout projection
Mr SMC Trading point
---
Conclusion:
This setup suggests a short-term bullish reversal from a key support area, with confirmation likely if price breaks above the descending trendline and clears the 200 EMA.
Please support boost 🚀 this analysis)
(Services:✔️ JOIN Telegram channel
#Gold trading ★Analysis★ 📊
Gold trading signals 🚀 99%
t.me/SmcTradingPoin
Join my recommended broker , link 👇
World best broker exness ✅D
one.exnesstrack.org/a/l1t1rf3p6v
#Gold trading ★Analysis★ 📊
Gold trading signals 🚀 99%
t.me/SmcTradingPoin
Join my recommended broker , link 👇
World best broker exness ✅D
one.exnesstrack.org/a/l1t1rf3p6v
Related publications
Disclaimer
The information and publications are not meant to be, and do not constitute, financial, investment, trading, or other types of advice or recommendations supplied or endorsed by TradingView. Read more in the Terms of Use.