🔹 GOLD/USD – Technical Analysis (1H Timeframe)
🔍 Market Structure Overview:
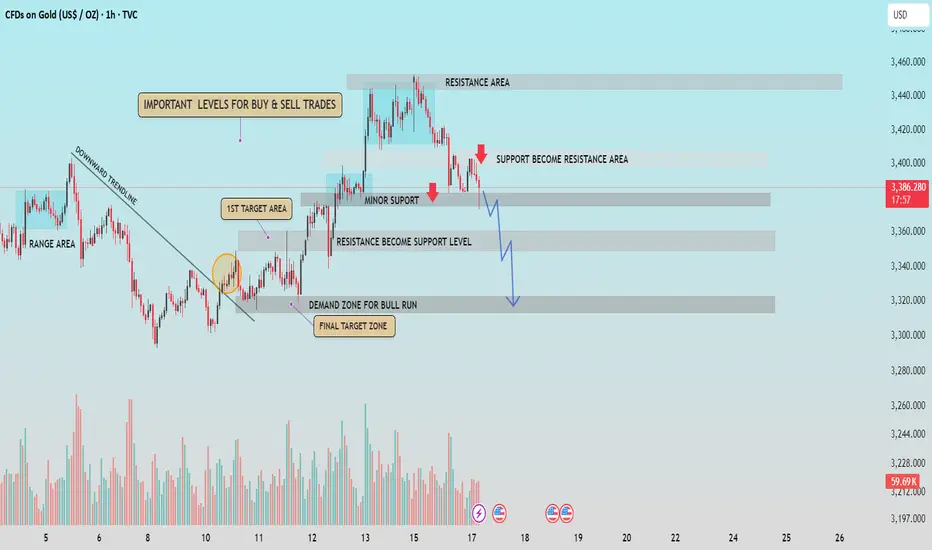
Gold is showing a clear bearish shift in structure after failing to hold above the 3,400 resistance zone. The price has now broken below multiple support levels, which have flipped into resistance - signaling strong downside pressure.
📉 Key Technical Highlights:
▫️ Downward Trendline: Previously broken to the upside, but the recent rejection indicates a potential bull trap.
▫️ Support Flip to Resistance: The 3,390-3,400 level now acts as strong resistance after being broken.
▫️ Minor Support Broken: Consecutive red candles and high-volume selling confirm bearish sentiment.
▫️ Bearish Continuation Pattern: The price is respecting a descending move and is likely to follow the projected downward leg.
📌 Important Price Levels:
▫️ Immediate Resistance: 3,390 - 3,400
▫️ Primary Support Zone: 3,360
▫️Final Bearish Target Zone: 3,310 - 3,320 (Demand Zone for possible reversal)
📈 Trade Outlook:
▫️Bias: Bearish
▫️ Preferred Strategy: Watch for pullbacks to resistance for short entries.
▫️ Invalidation Level: A sustained move above 3,420 would neutralize the bearish setup.
🔔 Final Notes:
Traders should monitor volume and price action near the 3,360 and 3,320 levels for potential reversal signs or continuation of the downtrend. Break and close below 3,360 increases probability for the final target zone being hit.
🔹Community Insight:
If you find this analysis helpful in your trading journey, feel free to share your thoughts or questions in the comments. Let’s work together to maintain a disciplined, technical approach to the markets.
▪️Follow for regular updates and trade setups.
🔍 Market Structure Overview:
Gold is showing a clear bearish shift in structure after failing to hold above the 3,400 resistance zone. The price has now broken below multiple support levels, which have flipped into resistance - signaling strong downside pressure.
📉 Key Technical Highlights:
▫️ Downward Trendline: Previously broken to the upside, but the recent rejection indicates a potential bull trap.
▫️ Support Flip to Resistance: The 3,390-3,400 level now acts as strong resistance after being broken.
▫️ Minor Support Broken: Consecutive red candles and high-volume selling confirm bearish sentiment.
▫️ Bearish Continuation Pattern: The price is respecting a descending move and is likely to follow the projected downward leg.
📌 Important Price Levels:
▫️ Immediate Resistance: 3,390 - 3,400
▫️ Primary Support Zone: 3,360
▫️Final Bearish Target Zone: 3,310 - 3,320 (Demand Zone for possible reversal)
📈 Trade Outlook:
▫️Bias: Bearish
▫️ Preferred Strategy: Watch for pullbacks to resistance for short entries.
▫️ Invalidation Level: A sustained move above 3,420 would neutralize the bearish setup.
🔔 Final Notes:
Traders should monitor volume and price action near the 3,360 and 3,320 levels for potential reversal signs or continuation of the downtrend. Break and close below 3,360 increases probability for the final target zone being hit.
🔹Community Insight:
If you find this analysis helpful in your trading journey, feel free to share your thoughts or questions in the comments. Let’s work together to maintain a disciplined, technical approach to the markets.
▪️Follow for regular updates and trade setups.
Note
1st layer activated 3394 , Note
Trade running 120 pips+Related publications
Disclaimer
The information and publications are not meant to be, and do not constitute, financial, investment, trading, or other types of advice or recommendations supplied or endorsed by TradingView. Read more in the Terms of Use.
Related publications
Disclaimer
The information and publications are not meant to be, and do not constitute, financial, investment, trading, or other types of advice or recommendations supplied or endorsed by TradingView. Read more in the Terms of Use.