The daily chart for CFDs on Gold (XAU/USD) indicates a potential short trade setup based on recent price action and liquidity analysis.
Key Levels:
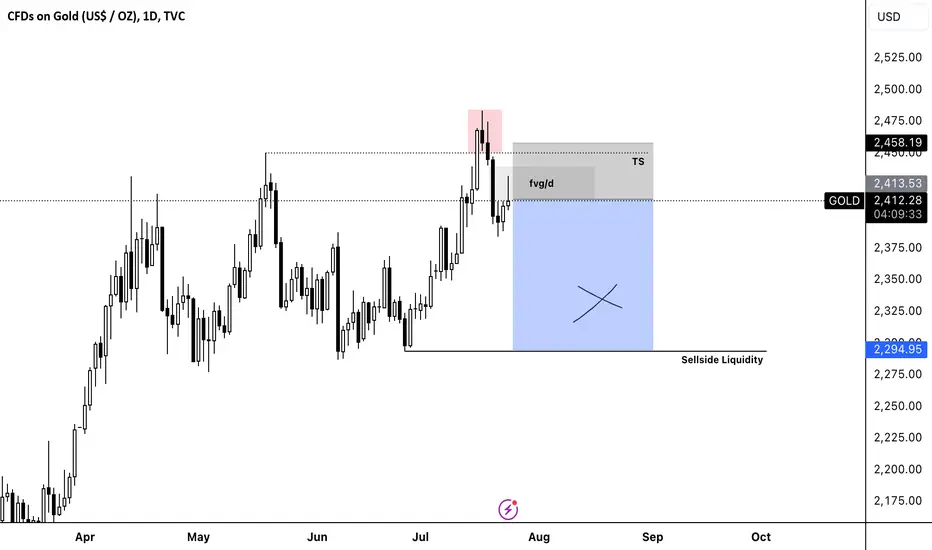
* Resistance Zone (TS): $2,458.19
* Current Price: $2,411.80
* Sellside Liquidity Target: $2,294.95
Analysis:
1. Fair Value Gap (FVG): The market has shown a fair value gap in the highlighted grey area, indicating potential bearish pressure if the price fails to reclaim this zone.
2. Liquidity: The blue zone marks an area where sellside liquidity is likely to be targeted. This area, around $2,294.95, could serve as a significant support level where short positions might consider taking profit.
3. TS: The red highlighted area near $2,458.19 represents a strong resistance zone where the price has previously rejected.
Trade Setup:
* Entry: Consider entering a short position around the current price level of $2,411.80, especially if the price shows signs of rejecting the FVG zone.
* Stop Loss: Place a stop loss above the recent high around $2,460.00 to protect against any unexpected bullish momentum.
* Take Profit: The initial take profit target should be set around the sellside liquidity at $2,294.95.
Key Levels:
* Resistance Zone (TS): $2,458.19
* Current Price: $2,411.80
* Sellside Liquidity Target: $2,294.95
Analysis:
1. Fair Value Gap (FVG): The market has shown a fair value gap in the highlighted grey area, indicating potential bearish pressure if the price fails to reclaim this zone.
2. Liquidity: The blue zone marks an area where sellside liquidity is likely to be targeted. This area, around $2,294.95, could serve as a significant support level where short positions might consider taking profit.
3. TS: The red highlighted area near $2,458.19 represents a strong resistance zone where the price has previously rejected.
Trade Setup:
* Entry: Consider entering a short position around the current price level of $2,411.80, especially if the price shows signs of rejecting the FVG zone.
* Stop Loss: Place a stop loss above the recent high around $2,460.00 to protect against any unexpected bullish momentum.
* Take Profit: The initial take profit target should be set around the sellside liquidity at $2,294.95.
💎💎- Professional Trader
💎💎 - Discord: discord.gg/gHKNVMyEvd
💎💎 - Trading Course: liquiditysweep369.carrd.co/
💎💎 - Discord: discord.gg/gHKNVMyEvd
💎💎 - Trading Course: liquiditysweep369.carrd.co/
Disclaimer
The information and publications are not meant to be, and do not constitute, financial, investment, trading, or other types of advice or recommendations supplied or endorsed by TradingView. Read more in the Terms of Use.