https://tradingview.sweetlogin.com/x/EYQStHvf/
💡Message Strategy
The United States has already participated in the war. On Saturday, the United States announced that it had carried out a devastating strike on Iran's nuclear facilities. Iran's nuclear facilities no longer exist, and emphasized that Iran must accept peace unconditionally.
After the strike, Iranian officials said that the US military bases and personnel in the Middle East will become legal total targets, and the United States and Israel will be severely retaliated.
After striking Iranian targets again, it was stated that Iran must accept peace talks and cannot retaliate. Obviously, the United States does not want to fall into the quagmire of the Middle East war, and Iran is unlikely to stop.
As a result, a new Middle East war has been formed, and the United States will be involved in this war anyway.
Once the war escalates, the capital market will dislike the huge waves again. Gold will enter the second half of the bull market.
After hitting the high of 3,500 in April, it has not been able to break through so far, but it has continued to fluctuate around the highs and has not fallen. A new support platform has been consolidated.
Gold will inevitably open higher next week, but whether it can continue to rise after opening higher depends on whether Iran launches a strong counterattack. If the counterattack is not strong enough or the losses caused are limited, the short-term increase in gold will still be limited, and it is more likely to be a volatile upward trend.
📊Technical aspects
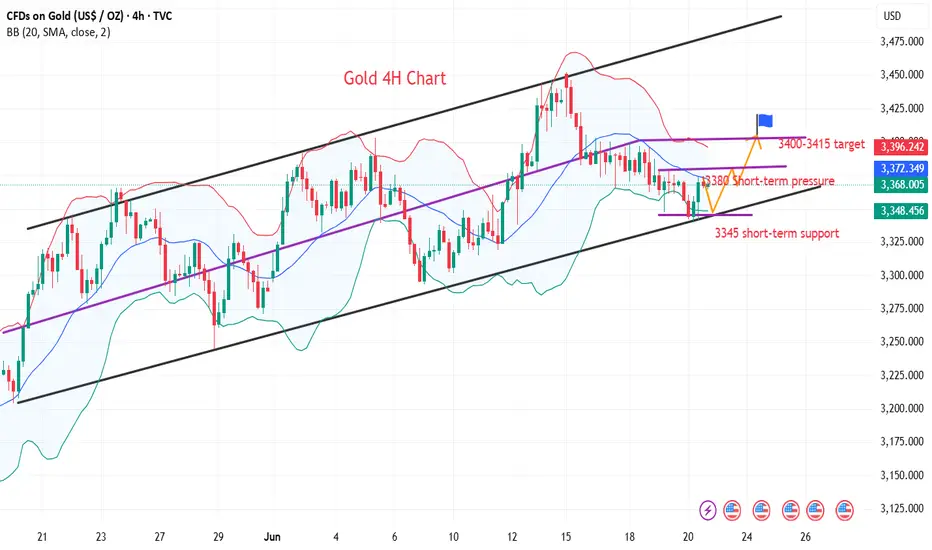
From the 4-hour analysis chart, the support below is around 3340-45, and the resistance above is around 3380-85, which is also near the 5-day moving average of the daily line and the middle track of the 4-hour Bollinger band. Breaking through here will ease the short-term downward pressure, and we can continue to pay attention to the high point of Thursday near 3390 US dollars;
For the support below gold, we can pay attention to the intraday low of 3340 US dollars, and then pay attention to the weekly MA10 moving average of 3315 US dollars. The 5-day moving average has a trend of forming a dead cross, the MACD indicator has begun to form a dead cross, and the KDJ and RSI indicators have a dead cross upward. The short-term technical aspect shows that the gold price has a further upward trend.
💰Strategy Package
Long Position:3355-3365,SL:3345,
Short-term goals: 3380-3390
💡Message Strategy
The United States has already participated in the war. On Saturday, the United States announced that it had carried out a devastating strike on Iran's nuclear facilities. Iran's nuclear facilities no longer exist, and emphasized that Iran must accept peace unconditionally.
After the strike, Iranian officials said that the US military bases and personnel in the Middle East will become legal total targets, and the United States and Israel will be severely retaliated.
After striking Iranian targets again, it was stated that Iran must accept peace talks and cannot retaliate. Obviously, the United States does not want to fall into the quagmire of the Middle East war, and Iran is unlikely to stop.
As a result, a new Middle East war has been formed, and the United States will be involved in this war anyway.
Once the war escalates, the capital market will dislike the huge waves again. Gold will enter the second half of the bull market.
After hitting the high of 3,500 in April, it has not been able to break through so far, but it has continued to fluctuate around the highs and has not fallen. A new support platform has been consolidated.
Gold will inevitably open higher next week, but whether it can continue to rise after opening higher depends on whether Iran launches a strong counterattack. If the counterattack is not strong enough or the losses caused are limited, the short-term increase in gold will still be limited, and it is more likely to be a volatile upward trend.
📊Technical aspects
From the 4-hour analysis chart, the support below is around 3340-45, and the resistance above is around 3380-85, which is also near the 5-day moving average of the daily line and the middle track of the 4-hour Bollinger band. Breaking through here will ease the short-term downward pressure, and we can continue to pay attention to the high point of Thursday near 3390 US dollars;
For the support below gold, we can pay attention to the intraday low of 3340 US dollars, and then pay attention to the weekly MA10 moving average of 3315 US dollars. The 5-day moving average has a trend of forming a dead cross, the MACD indicator has begun to form a dead cross, and the KDJ and RSI indicators have a dead cross upward. The short-term technical aspect shows that the gold price has a further upward trend.
💰Strategy Package
Long Position:3355-3365,SL:3345,
Short-term goals: 3380-3390
Trade active
Gold may become a hot spot again in the futureThrough scientific and rigorous financial analysis and personalized strategy formulation, we help you achieve stable growth of wealth. At the same time, in a complex and changing economic environment, we help you avoid potential risks and protect the saf
Related publications
Disclaimer
The information and publications are not meant to be, and do not constitute, financial, investment, trading, or other types of advice or recommendations supplied or endorsed by TradingView. Read more in the Terms of Use.
Through scientific and rigorous financial analysis and personalized strategy formulation, we help you achieve stable growth of wealth. At the same time, in a complex and changing economic environment, we help you avoid potential risks and protect the saf
Related publications
Disclaimer
The information and publications are not meant to be, and do not constitute, financial, investment, trading, or other types of advice or recommendations supplied or endorsed by TradingView. Read more in the Terms of Use.