Gold Technical Analysis:
Daily Chart Resistance: 3410, Support: 3300
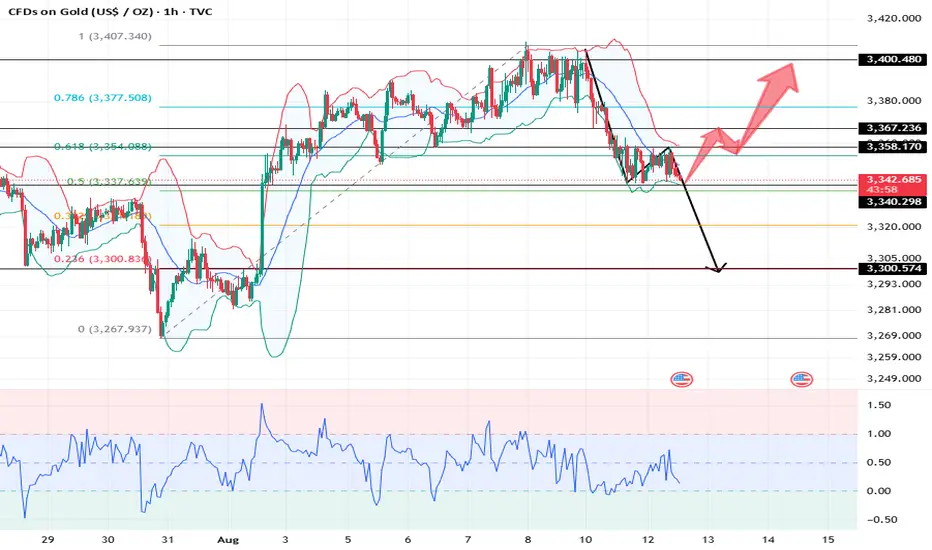
4-Hour Chart Resistance: 3367, Support: 3338
1-Hour Chart Resistance: 3358, Support: 3340.
Gold continued its downward trend yesterday, erasing the gains of the previous five trading days. The chart shows significant selling pressure above 3400, with prices retreating to around 3340. Today's strategy is to focus on 3340 and 3367. We should also keep an eye on the US CPI data from the New York market, as the market generally responds to significant news to drive major moves.
For intraday trading, gold's upper resistance remains at 3365. If it fails to break through and hold above 3365, it will likely continue its downward trend. Consider selling when it rebounds to 3367-3370 and encounters resistance. Buy at the intraday low of 3340 and continue selling after it breaks below this low.
BUY:3344near
SELL:3338near
SELL:3367near
Daily Chart Resistance: 3410, Support: 3300
4-Hour Chart Resistance: 3367, Support: 3338
1-Hour Chart Resistance: 3358, Support: 3340.
Gold continued its downward trend yesterday, erasing the gains of the previous five trading days. The chart shows significant selling pressure above 3400, with prices retreating to around 3340. Today's strategy is to focus on 3340 and 3367. We should also keep an eye on the US CPI data from the New York market, as the market generally responds to significant news to drive major moves.
For intraday trading, gold's upper resistance remains at 3365. If it fails to break through and hold above 3365, it will likely continue its downward trend. Consider selling when it rebounds to 3367-3370 and encounters resistance. Buy at the intraday low of 3340 and continue selling after it breaks below this low.
BUY:3344near
SELL:3338near
SELL:3367near
💥Telegram Channel Free Updates 👉🏻
💥t.me/Actuary00group
✉️Gold Signal and daily analysis channel
💥t.me/Actuary00group
✉️Gold Signal and daily analysis channel
Disclaimer
The information and publications are not meant to be, and do not constitute, financial, investment, trading, or other types of advice or recommendations supplied or endorsed by TradingView. Read more in the Terms of Use.