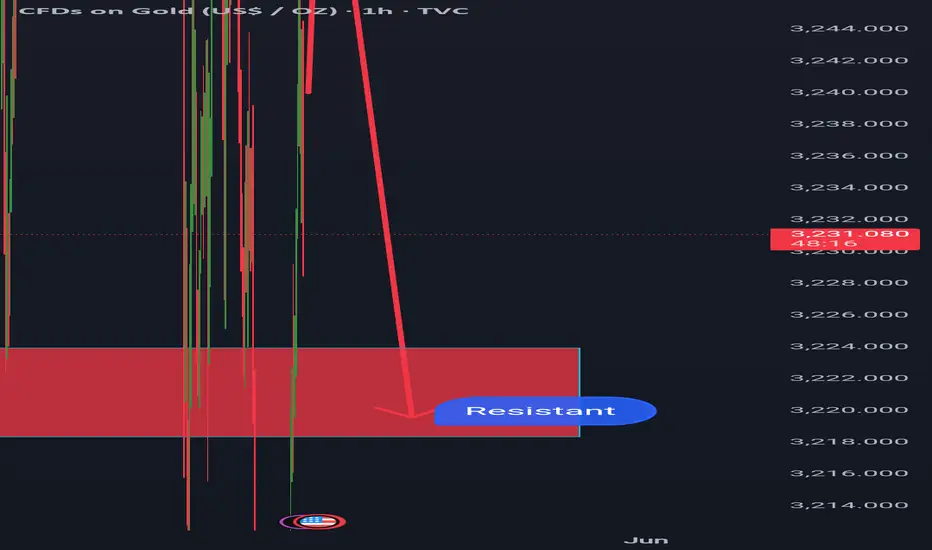
The chart you've shared is a 1-hour candlestick chart of Gold (CFDs on Gold - USD/OZ) from TradingView. Here’s a quick analysis based on the visual elements:
Current Price: Around $3,231.45
Resistance Zone: Marked in red between approximately $3,214 and $3,224
Price Action: A red arrow indicates a forecast or observed rejection from higher levels toward the resistance zone.
Interpretation: The chart suggests that if the price re-enters or tests the red-shaded resistance zone again, it might face selling pressure and drop further.
Let me know if you'd like a detailed technical analysis or strategy (e.g., entry/exit levels, stop-loss setup, or confirmation signals).
Disclaimer
The information and publications are not meant to be, and do not constitute, financial, investment, trading, or other types of advice or recommendations supplied or endorsed by TradingView. Read more in the Terms of Use.
Disclaimer
The information and publications are not meant to be, and do not constitute, financial, investment, trading, or other types of advice or recommendations supplied or endorsed by TradingView. Read more in the Terms of Use.