https://tradingview.sweetlogin.com/x/rpNea71Y/
💡Message Strategy
Trump announced on Friday that he would impose a 35% comprehensive tariff on Canadian imports, which will take effect on August 1, which caused a market shock. As Canada's largest trading partner, the United States accounts for 76% of Canada's exports in 2024. This move will undoubtedly have a profound impact on the global supply chain and trade pattern.
In addition, Trump's tariff policies on copper and Brazil have further exacerbated market uncertainty, pushing gold prices to break through key technical resistance levels and move towards the $3,400 mark.
The Fed's policy moves also have an important impact on market sentiment. The minutes of the June meeting released on Wednesday showed that the Fed's internal concerns about tariffs potentially pushing up inflation are growing. The minutes pointed out that "most participants emphasized that tariffs could have a more lasting impact on inflation."
Despite this, the Fed reiterated that it would remain on the sidelines and wait for further clarity on inflation and economic activity. At present, according to the market forecast of the CME FedWatch tool, the probability of a 25 basis point rate cut in September has risen to 62.9%, reflecting investors' expectations that the Fed may ease early.
📊Technical aspects
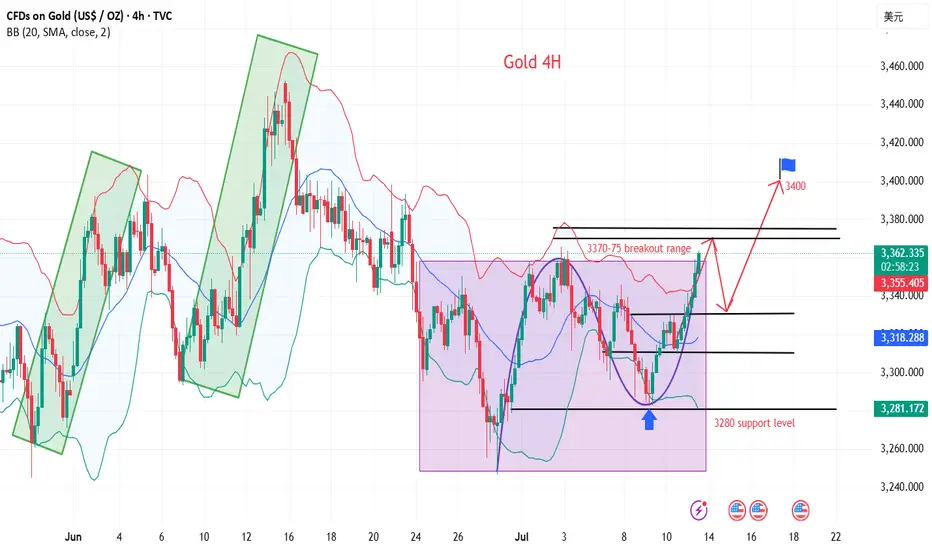
Yesterday’s strategic recommendations mentioned that the effective support level for gold was in the 3280-3285 range. Today, gold fell back to the 3280 level, stabilized, and began to rise, perfectly reaching the target.
From a technical perspective, gold has shown significant upward momentum this week. The daily chart shows that the price of gold has successfully broken through the symmetrical triangle resistance and touched the 20-day simple moving average (SMA) of $3,339.97.
This breakthrough marks a strengthening of the short-term technical pattern, showing that bulls have the upper hand. The relative strength index (RSI) has rebounded to around 55 on the daily chart and is trending upward, indicating that there is slight bullish momentum in the market.
However, in the short term, the upside of gold may be limited by the 23.6% Fibonacci retracement level ($3,370). If this level can be effectively broken, the psychological level of $3,400 and the June high of $3,452 will become the next target.
💰Strategy Package
Long Position:3335-3340,SL:3320,Target: 3370-3400
💡Message Strategy
Trump announced on Friday that he would impose a 35% comprehensive tariff on Canadian imports, which will take effect on August 1, which caused a market shock. As Canada's largest trading partner, the United States accounts for 76% of Canada's exports in 2024. This move will undoubtedly have a profound impact on the global supply chain and trade pattern.
In addition, Trump's tariff policies on copper and Brazil have further exacerbated market uncertainty, pushing gold prices to break through key technical resistance levels and move towards the $3,400 mark.
The Fed's policy moves also have an important impact on market sentiment. The minutes of the June meeting released on Wednesday showed that the Fed's internal concerns about tariffs potentially pushing up inflation are growing. The minutes pointed out that "most participants emphasized that tariffs could have a more lasting impact on inflation."
Despite this, the Fed reiterated that it would remain on the sidelines and wait for further clarity on inflation and economic activity. At present, according to the market forecast of the CME FedWatch tool, the probability of a 25 basis point rate cut in September has risen to 62.9%, reflecting investors' expectations that the Fed may ease early.
📊Technical aspects
Yesterday’s strategic recommendations mentioned that the effective support level for gold was in the 3280-3285 range. Today, gold fell back to the 3280 level, stabilized, and began to rise, perfectly reaching the target.
From a technical perspective, gold has shown significant upward momentum this week. The daily chart shows that the price of gold has successfully broken through the symmetrical triangle resistance and touched the 20-day simple moving average (SMA) of $3,339.97.
This breakthrough marks a strengthening of the short-term technical pattern, showing that bulls have the upper hand. The relative strength index (RSI) has rebounded to around 55 on the daily chart and is trending upward, indicating that there is slight bullish momentum in the market.
However, in the short term, the upside of gold may be limited by the 23.6% Fibonacci retracement level ($3,370). If this level can be effectively broken, the psychological level of $3,400 and the June high of $3,452 will become the next target.
💰Strategy Package
Long Position:3335-3340,SL:3320,Target: 3370-3400
Trade active
The trend of gold is all within the scope of the layout, pay attention to TheoThrough scientific and rigorous financial analysis and personalized strategy formulation, we help you achieve stable growth of wealth. At the same time, in a complex and changing economic environment, we help you avoid potential risks and protect the saf
Related publications
Disclaimer
The information and publications are not meant to be, and do not constitute, financial, investment, trading, or other types of advice or recommendations supplied or endorsed by TradingView. Read more in the Terms of Use.
Through scientific and rigorous financial analysis and personalized strategy formulation, we help you achieve stable growth of wealth. At the same time, in a complex and changing economic environment, we help you avoid potential risks and protect the saf
Related publications
Disclaimer
The information and publications are not meant to be, and do not constitute, financial, investment, trading, or other types of advice or recommendations supplied or endorsed by TradingView. Read more in the Terms of Use.