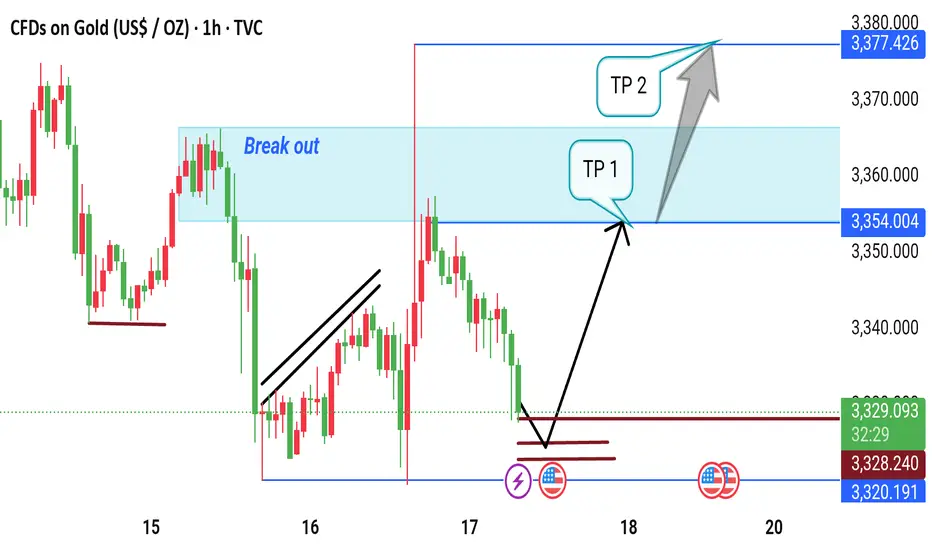
This 1-hour gold (XAU/USD) chart shows a potential bullish setup. Price is currently near support at 3,320.191, with possible reversal signals forming. The chart highlights a previous breakout zone around 3,354.004. If price rebounds, targets are set at TP1 (3,354.004) and TP2 (3,377.426). Key events and technical signals suggest a potential move upward.
Trade active
Hold noFree Telegram Signals'⏫⏬
t.me/GoldSignalsFx_2
✅GOLD
✅BTC USD
✅EUR USD
✅USD JPY
Telegram Channel 👇👇👇👇👇👇👇👇👇👇👇👇👇
t.me/GoldSignalsFx_2
t.me/GoldSignalsFx_2
✅GOLD
✅BTC USD
✅EUR USD
✅USD JPY
Telegram Channel 👇👇👇👇👇👇👇👇👇👇👇👇👇
t.me/GoldSignalsFx_2
Disclaimer
The information and publications are not meant to be, and do not constitute, financial, investment, trading, or other types of advice or recommendations supplied or endorsed by TradingView. Read more in the Terms of Use.
Free Telegram Signals'⏫⏬
t.me/GoldSignalsFx_2
✅GOLD
✅BTC USD
✅EUR USD
✅USD JPY
Telegram Channel 👇👇👇👇👇👇👇👇👇👇👇👇👇
t.me/GoldSignalsFx_2
t.me/GoldSignalsFx_2
✅GOLD
✅BTC USD
✅EUR USD
✅USD JPY
Telegram Channel 👇👇👇👇👇👇👇👇👇👇👇👇👇
t.me/GoldSignalsFx_2
Disclaimer
The information and publications are not meant to be, and do not constitute, financial, investment, trading, or other types of advice or recommendations supplied or endorsed by TradingView. Read more in the Terms of Use.