XAU/USD (Gold) 15-Min Chart Analysis – July 10, 2025
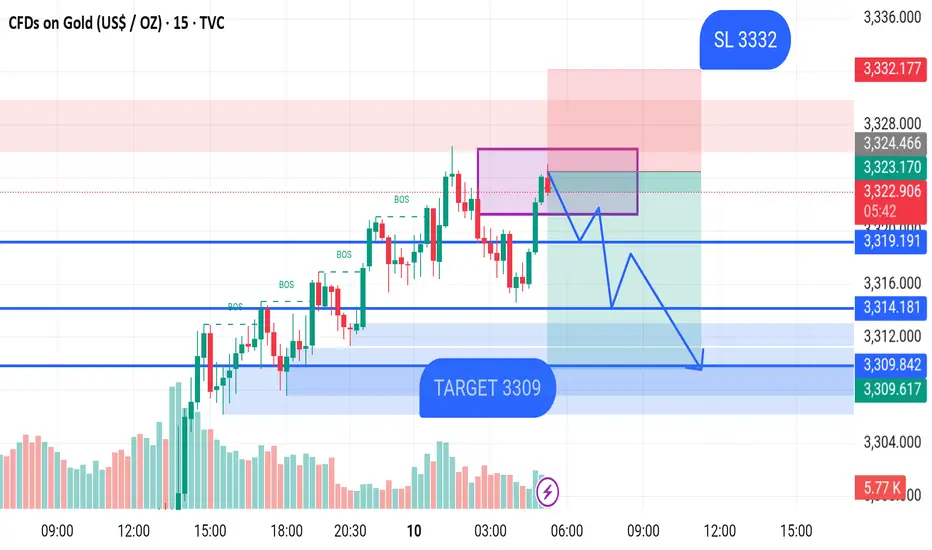
The chart shows that price is currently trading around 3323.98, approaching a key supply zone marked in purple. This area is expected to act as resistance, where price may reverse.
Multiple Break of Structure (BOS) levels have been marked, confirming bullish momentum earlier. However, the chart now suggests a potential bearish reversal from the supply zone.
Trade Idea:
Entry Zone: Near the top of the purple resistance area (~3324)
Stop Loss (SL): 3332
Target: 3309 zone (highlighted in blue), which aligns with the demand zone and previous structure
Key Levels:
Resistance Zone: 3324–3332
Support Zones:
First Support: 3319.19
Second Support: 3314.18
Final Target Zone: 3309.84 – 3309.61
The expected move is a sell from the supply zone down to the 3309 target. Price is projected to form lower highs and lower lows as shown by the blue arrow path.
Trade active
Trade closed: target reached
Premium Signals | Consistent Profits
DM for access & Trade Smarter
TG : t.me/GOLDPIPSSNIPERm
EXness: one.exnesstrack.org/a/m14yhu78xv
DM for access & Trade Smarter
TG : t.me/GOLDPIPSSNIPERm
EXness: one.exnesstrack.org/a/m14yhu78xv
Disclaimer
The information and publications are not meant to be, and do not constitute, financial, investment, trading, or other types of advice or recommendations supplied or endorsed by TradingView. Read more in the Terms of Use.