visit fourtrades website for more info
Current Market Overview
Gold has recently experienced a notable upward trend, breaking through key resistance levels and forming higher highs and higher lows. As observed on the daily chart, gold has broken out of a consolidation phase, signaling potential further upside momentum.
Technical Analysis
Daily Chart:
Breakout and Retest: The daily chart shows gold breaking out of a significant consolidation zone. The price action indicates a strong bullish momentum, with a possible retest of the breakout zone around $2,450 before continuing higher.
Key Levels: Immediate support is identified at the previous resistance level around $2,450. A break below this level could lead to further downside towards $2,420. The next resistance is around $2,500 and $2,520.
4-Hour Chart:
Ascending Channel: Gold is trading within an ascending channel, and it is currently approaching the lower boundary of the channel, which could act as a support level.
Potential Pullback Zone: The 4-hour chart suggests a potential pullback to the $2,440-$2,450 zone, which aligns with the lower boundary of the ascending channel. This zone is a crucial buying opportunity if the price action shows bullish signals.
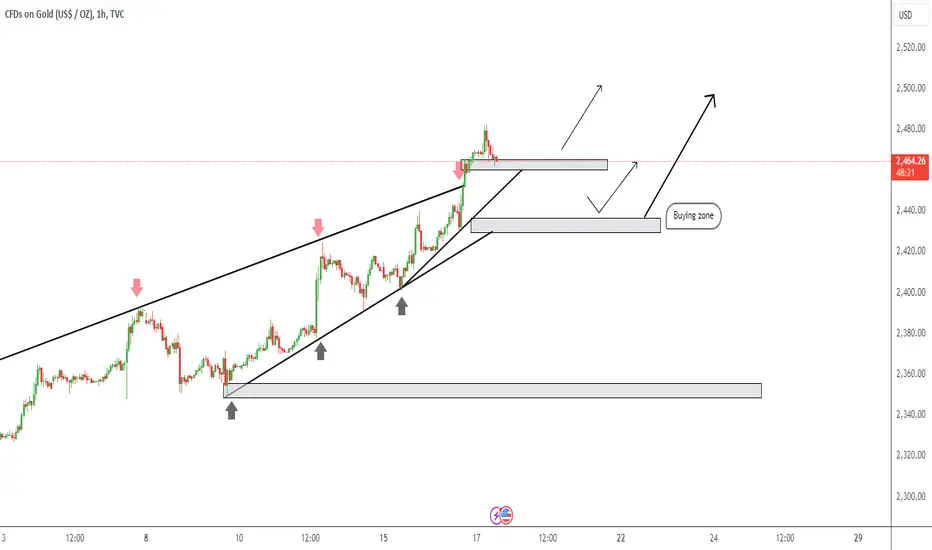
1-Hour Chart:
Immediate Support and Resistance: The 1-hour chart highlights immediate support at $2,460. If this level holds, we could see a bounce back towards $2,480 and potentially $2,500.
Bullish Momentum: The price action indicates bullish momentum with higher highs and higher lows. Monitoring the reaction at the $2,460 support level will be crucial for short-term trading decisions.
Current Market Overview
Gold has recently experienced a notable upward trend, breaking through key resistance levels and forming higher highs and higher lows. As observed on the daily chart, gold has broken out of a consolidation phase, signaling potential further upside momentum.
Technical Analysis
Daily Chart:
Breakout and Retest: The daily chart shows gold breaking out of a significant consolidation zone. The price action indicates a strong bullish momentum, with a possible retest of the breakout zone around $2,450 before continuing higher.
Key Levels: Immediate support is identified at the previous resistance level around $2,450. A break below this level could lead to further downside towards $2,420. The next resistance is around $2,500 and $2,520.
4-Hour Chart:
Ascending Channel: Gold is trading within an ascending channel, and it is currently approaching the lower boundary of the channel, which could act as a support level.
Potential Pullback Zone: The 4-hour chart suggests a potential pullback to the $2,440-$2,450 zone, which aligns with the lower boundary of the ascending channel. This zone is a crucial buying opportunity if the price action shows bullish signals.
1-Hour Chart:
Immediate Support and Resistance: The 1-hour chart highlights immediate support at $2,460. If this level holds, we could see a bounce back towards $2,480 and potentially $2,500.
Bullish Momentum: The price action indicates bullish momentum with higher highs and higher lows. Monitoring the reaction at the $2,460 support level will be crucial for short-term trading decisions.
Note
Signal 1: Buy PositionEntry Point: $2,460
Stop Loss: $2,440
Take Profit: $2,500
Status: Active
Trade Type: Buy
Rationale: The price is currently in an ascending channel with strong bullish momentum. Entering at the support level of $2,460 provides a good risk-reward ratio, targeting the next resistance at $2,500.
Signal 2: Buy Position
Entry Point: $2,450
Stop Loss: $2,430
Take Profit: $2,480
Status: Pending
Trade Type: Buy
Rationale: A potential pullback to $2,450, which is the lower boundary of the ascending channel on the 4-hour chart, offers an excellent buying opportunity with a tight stop loss.
Disclaimer
The information and publications are not meant to be, and do not constitute, financial, investment, trading, or other types of advice or recommendations supplied or endorsed by TradingView. Read more in the Terms of Use.
Disclaimer
The information and publications are not meant to be, and do not constitute, financial, investment, trading, or other types of advice or recommendations supplied or endorsed by TradingView. Read more in the Terms of Use.