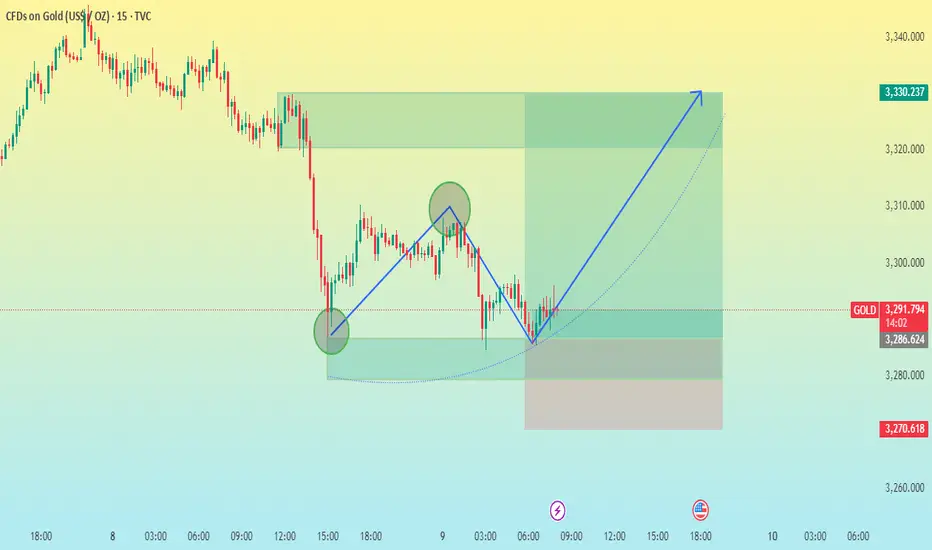
This chart is a 15-minute candlestick chart of Gold (XAU/USD) as of July 9, 2025, and it shows technical analysis using price action, chart patterns, and risk-reward mapping. Here's a comprehensive breakdown:
---
🔍 1. Pattern Analysis:
Cup and Handle Pattern (Potential Formation):
The chart shows a curved “U” shape forming a base (highlighted by the dotted curved line), suggesting the cup.
A handle seems to be forming or has formed recently, a typical consolidation phase after the cup.
The breakout is expected to occur to the upside, as indicated by the blue upward arrow.
---
📉 Price Levels and Zones:
Current Price: 3,294.474
Support Zone: Around 3,270.618 (red line – likely the stop-loss level)
Resistance/Target Zone: 3,330.237 (green upper target box)
Risk-Reward Ratio: Favorable — the reward zone is significantly wider than the risk zone.
---
🟩 Key Technical Markings:
Green Circles: Indicate potential swing low (left base of cup) and swing high (top of handle).
Blue Arrows: Outline the anticipated bullish breakout trajectory.
Rectangles:
Green Rectangle above the current price indicates the take profit/target area.
Red Rectangle below the current price indicates the stop-loss zone.
---
📈 Volume & Momentum (Implied):
While volume isn't shown directly, the chart implies momentum building at the handle, a classic precursor to breakout in such formations.
The bullish bias is further supported by higher lows forming along the curved base.
---
⏰ Time Context:
The chart timeframe is 15-minute candles, making this a short-term/intraday setup.
The anticipated move may complete within a few hours to a trading day if the pattern plays out.
---
📊 Trading Plan Summary (based on chart):
Parameter Value
Entry (approx.) 3,294
Stop Loss 3,270
Take Profit 3,330
Risk:Reward ~1:1.5+
---
✅ Conclusion:
The chart shows a bullish cup and handle formation with a clear plan for a long trade.
The setup looks technically sound with a defined risk and upside potential.
Ideal confirmation would be a strong breakout candle with volume from the handle area.
Would you like a trading strategy or script based on this chart for automation (e.g., in TradingView Pine Script)?
---
🔍 1. Pattern Analysis:
Cup and Handle Pattern (Potential Formation):
The chart shows a curved “U” shape forming a base (highlighted by the dotted curved line), suggesting the cup.
A handle seems to be forming or has formed recently, a typical consolidation phase after the cup.
The breakout is expected to occur to the upside, as indicated by the blue upward arrow.
---
📉 Price Levels and Zones:
Current Price: 3,294.474
Support Zone: Around 3,270.618 (red line – likely the stop-loss level)
Resistance/Target Zone: 3,330.237 (green upper target box)
Risk-Reward Ratio: Favorable — the reward zone is significantly wider than the risk zone.
---
🟩 Key Technical Markings:
Green Circles: Indicate potential swing low (left base of cup) and swing high (top of handle).
Blue Arrows: Outline the anticipated bullish breakout trajectory.
Rectangles:
Green Rectangle above the current price indicates the take profit/target area.
Red Rectangle below the current price indicates the stop-loss zone.
---
📈 Volume & Momentum (Implied):
While volume isn't shown directly, the chart implies momentum building at the handle, a classic precursor to breakout in such formations.
The bullish bias is further supported by higher lows forming along the curved base.
---
⏰ Time Context:
The chart timeframe is 15-minute candles, making this a short-term/intraday setup.
The anticipated move may complete within a few hours to a trading day if the pattern plays out.
---
📊 Trading Plan Summary (based on chart):
Parameter Value
Entry (approx.) 3,294
Stop Loss 3,270
Take Profit 3,330
Risk:Reward ~1:1.5+
---
✅ Conclusion:
The chart shows a bullish cup and handle formation with a clear plan for a long trade.
The setup looks technically sound with a defined risk and upside potential.
Ideal confirmation would be a strong breakout candle with volume from the handle area.
Would you like a trading strategy or script based on this chart for automation (e.g., in TradingView Pine Script)?
t.me/+vT7LZx7w13BlNjI0
✅ XAUUSD SIGNALS
💯JOIN FREE TELEGRAM CHANNEL
t.me/+vT7LZx7w13BlNjI0
✔REGISTERED broker
partners.vantagemarkets.com/ib-cpa-register/?url=ib&affid=7264705
✔Referral code 72647
✅ XAUUSD SIGNALS
💯JOIN FREE TELEGRAM CHANNEL
t.me/+vT7LZx7w13BlNjI0
✔REGISTERED broker
partners.vantagemarkets.com/ib-cpa-register/?url=ib&affid=7264705
✔Referral code 72647
Disclaimer
The information and publications are not meant to be, and do not constitute, financial, investment, trading, or other types of advice or recommendations supplied or endorsed by TradingView. Read more in the Terms of Use.
t.me/+vT7LZx7w13BlNjI0
✅ XAUUSD SIGNALS
💯JOIN FREE TELEGRAM CHANNEL
t.me/+vT7LZx7w13BlNjI0
✔REGISTERED broker
partners.vantagemarkets.com/ib-cpa-register/?url=ib&affid=7264705
✔Referral code 72647
✅ XAUUSD SIGNALS
💯JOIN FREE TELEGRAM CHANNEL
t.me/+vT7LZx7w13BlNjI0
✔REGISTERED broker
partners.vantagemarkets.com/ib-cpa-register/?url=ib&affid=7264705
✔Referral code 72647
Disclaimer
The information and publications are not meant to be, and do not constitute, financial, investment, trading, or other types of advice or recommendations supplied or endorsed by TradingView. Read more in the Terms of Use.