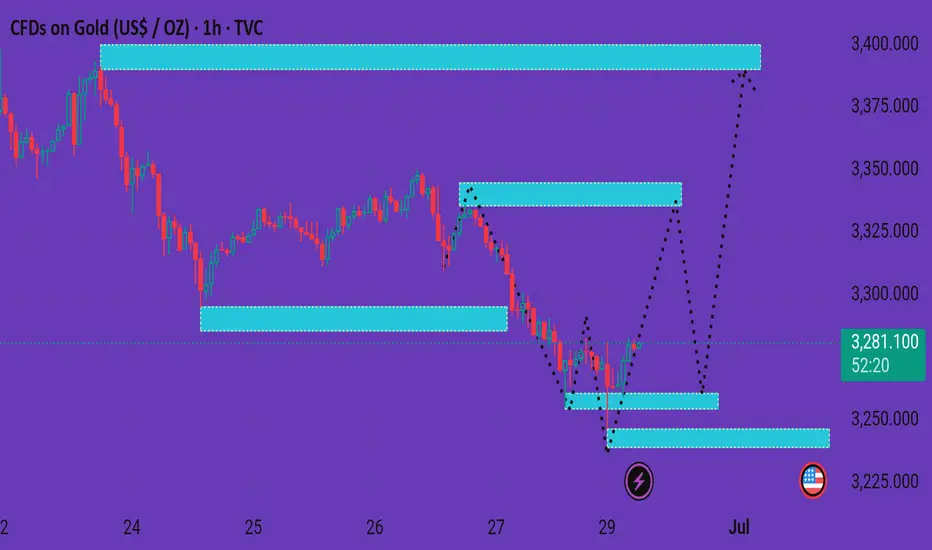
The chart you've shared is a 1-hour timeframe for Gold (CFDs on Gold, US$ / OZ) and seems to illustrate a potential bullish reversal scenario. Here's a detailed breakdown:
---
🔍 Chart Overview
Current Price: 3,280.920
Recent Movement: Price has been in a downtrend but recently formed a potential bottom with some sideways consolidation.
---
🟦 Highlighted Zones
1. Support Zone (Bottom - ~3,240)
Marked with a U.S. flag emoji (likely news-related support).
Price previously bounced from this zone — a key area of demand.
2. Mid-Level Supply/Resistance Zone (~3,300–3,320)
Price may test this zone if bullish momentum continues.
A key intraday resistance to watch.
3. Upper Supply Zone (~3,360–3,400)
If price breaks the mid-level zone, this is the next potential target.
Final bullish target area.
---
📈 Projected Paths (Dashed Lines)
Primary Scenario:
Bounce from current level → retest mid-resistance (~3,320) → possible breakout → target upper zone (~3,400).
Alternative Scenario:
Slight retracement back to the lower support (~3,260–3,245) before rallying to higher zones.
---
🔄 Interpretation
Bullish Bias: The chart is structured for a bullish reversal.
Confirmation Needed: A break and hold above the mid-resistance (~3,320) would validate the bullish path.
Risk Zone: If price falls below the bottom support (~3,240), the bullish setup may be invalidated.
---
Would you like a trading plan or entry/exit suggestion based on this setup?
---
🔍 Chart Overview
Current Price: 3,280.920
Recent Movement: Price has been in a downtrend but recently formed a potential bottom with some sideways consolidation.
---
🟦 Highlighted Zones
1. Support Zone (Bottom - ~3,240)
Marked with a U.S. flag emoji (likely news-related support).
Price previously bounced from this zone — a key area of demand.
2. Mid-Level Supply/Resistance Zone (~3,300–3,320)
Price may test this zone if bullish momentum continues.
A key intraday resistance to watch.
3. Upper Supply Zone (~3,360–3,400)
If price breaks the mid-level zone, this is the next potential target.
Final bullish target area.
---
📈 Projected Paths (Dashed Lines)
Primary Scenario:
Bounce from current level → retest mid-resistance (~3,320) → possible breakout → target upper zone (~3,400).
Alternative Scenario:
Slight retracement back to the lower support (~3,260–3,245) before rallying to higher zones.
---
🔄 Interpretation
Bullish Bias: The chart is structured for a bullish reversal.
Confirmation Needed: A break and hold above the mid-resistance (~3,320) would validate the bullish path.
Risk Zone: If price falls below the bottom support (~3,240), the bullish setup may be invalidated.
---
Would you like a trading plan or entry/exit suggestion based on this setup?
t.me/+EQ88IkMSUvQwMGJk
Join telegram channel free
t.me/+EQ88IkMSUvQwMGJk
Join telegram channel free
t.me/+EQ88IkMSUvQwMGJk
Disclaimer
The information and publications are not meant to be, and do not constitute, financial, investment, trading, or other types of advice or recommendations supplied or endorsed by TradingView. Read more in the Terms of Use.
t.me/+EQ88IkMSUvQwMGJk
Join telegram channel free
t.me/+EQ88IkMSUvQwMGJk
Join telegram channel free
t.me/+EQ88IkMSUvQwMGJk
Disclaimer
The information and publications are not meant to be, and do not constitute, financial, investment, trading, or other types of advice or recommendations supplied or endorsed by TradingView. Read more in the Terms of Use.