This chart appears to show a technical analysis of gold prices (XAU/USD) on a 15-minute timeframe. Here's a breakdown of the key elements:
---
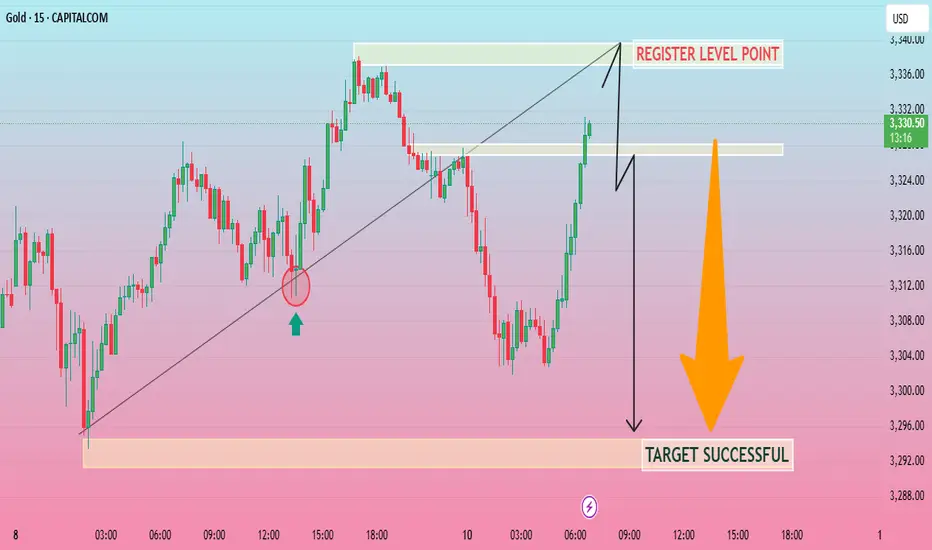
🔍 Key Chart Features
Green Arrow & Circle: Marks a bullish entry point, likely where price respected a trendline and bounced up.
Rising Trendline: Indicates the short-term bullish trend leading into a peak.
"REGISTER LEVEL POINT" (Resistance Area ~3336–3340): This zone is likely where traders anticipate a reversal or sell-off.
Price Projection: The zigzag black line suggests a projected move upward to the resistance, then a sharp decline.
"TARGET SUCCESSFUL" Zone (~3288–3292): Indicates a bearish price target was hit, suggesting a successful short trade after hitting resistance.
Current Price: 3328.25 USD.
---
📈 Interpretation
This looks like a completed price action playbook:
1. Buy near support (green arrow).
2. Sell or short near the resistance ("REGISTER LEVEL POINT").
3. Target achieved around the demand zone ("TARGET SUCCESSFUL").
---
🧠 Trading Insights
The setup relies on:
Trendline support for entry
Resistance zone for exit or short
Price retracement toward a known support/demand zone
This type of analysis is typical of price action trading strategies, where key levels and candlestick behavior guide entries and exits.
Let me know if you'd like help with:
Marking similar levels on your own chart
Creating a script/alert for these setups
Strategy automation in TradingView (Pine Script)
---
🔍 Key Chart Features
Green Arrow & Circle: Marks a bullish entry point, likely where price respected a trendline and bounced up.
Rising Trendline: Indicates the short-term bullish trend leading into a peak.
"REGISTER LEVEL POINT" (Resistance Area ~3336–3340): This zone is likely where traders anticipate a reversal or sell-off.
Price Projection: The zigzag black line suggests a projected move upward to the resistance, then a sharp decline.
"TARGET SUCCESSFUL" Zone (~3288–3292): Indicates a bearish price target was hit, suggesting a successful short trade after hitting resistance.
Current Price: 3328.25 USD.
---
📈 Interpretation
This looks like a completed price action playbook:
1. Buy near support (green arrow).
2. Sell or short near the resistance ("REGISTER LEVEL POINT").
3. Target achieved around the demand zone ("TARGET SUCCESSFUL").
---
🧠 Trading Insights
The setup relies on:
Trendline support for entry
Resistance zone for exit or short
Price retracement toward a known support/demand zone
This type of analysis is typical of price action trading strategies, where key levels and candlestick behavior guide entries and exits.
Let me know if you'd like help with:
Marking similar levels on your own chart
Creating a script/alert for these setups
Strategy automation in TradingView (Pine Script)
Trade active
trade activeDisclaimer
The information and publications are not meant to be, and do not constitute, financial, investment, trading, or other types of advice or recommendations supplied or endorsed by TradingView. Read more in the Terms of Use.
Disclaimer
The information and publications are not meant to be, and do not constitute, financial, investment, trading, or other types of advice or recommendations supplied or endorsed by TradingView. Read more in the Terms of Use.