🧠 Order Block-Based Market Structure Analysis
In this analysis, we leverage Smart Money Concepts (SMC), focusing on the interaction between order blocks and market structure on the H4 and Daily timeframes. This hybrid approach enables a high-probability forecast of price action within a strategic framework.
🟢 Market Structure Overview
The current structure is forming an ascending range with higher lows, suggesting bullish intent — but with no clear breakout above previous structural highs yet. The market is essentially building liquidity traps around premium zones, setting up for a potential expansion move.
🔶 Key Zones Identified
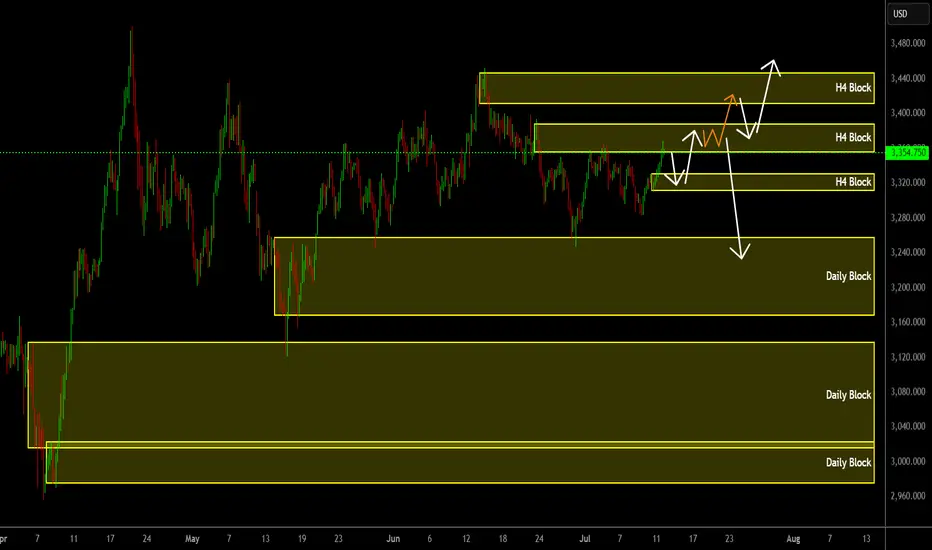
H4 Supply Blocks (Upper Resistance Areas)
Three H4-level order blocks are stacked above the current price, each representing potential points of liquidity absorption or reversal:
First Block: Minor resistance, likely to be breached.
Second Block: Main liquidity zone where sellers may become active.
Third Block: Final trap or target zone in case of aggressive bullish expansion.
Daily Demand Blocks (Deeper Support Areas)
Three major Daily order blocks are marked below. These are institutional accumulation zones and key areas for potential price reaction or reversal:
Zone 1: Short-term support
Zone 2: Mid-term support with stronger price memory
Zone 3: High-confluence zone likely to be defended if reached
📈 Scenario Projections
✅ Bullish Scenario (Primary Path - White Arrows)
Price may first revisit a minor H4 OB below.
If price breaks the local high, we expect movement toward the second and third H4 OBs.
A clean break of those zones confirms a bullish continuation structure.
⚠️ Bearish/Corrective Scenario (Alternative Path - Orange & White Arrows)
If price fails to break above the second H4 OB and shows signs of exhaustion or liquidity sweep:
We could see a sharp rejection.
Breakdown of support may lead to a drop toward the Daily OB at 3240, or even deeper levels near 3080 or 3000 if momentum strengthens.
🔍 Key Trading Insights
Wait for confirmation candles (impulse + volume spike) around order blocks before execution.
Monitor volume behavior at key zones — strong volume without movement can indicate absorption.
Daily blocks are ideal long entry zones if structure and reaction confirm institutional buying.
🎯 Conclusion
This dual scenario strategy based on H4 and Daily order blocks provides traders with a clear directional roadmap. The reaction to the middle H4 OB will be the turning point — either leading to a breakout rally or a breakdown into deeper institutional zones.
📌 Stay patient and let price reveal its intent around these engineered liquidity levels.
In this analysis, we leverage Smart Money Concepts (SMC), focusing on the interaction between order blocks and market structure on the H4 and Daily timeframes. This hybrid approach enables a high-probability forecast of price action within a strategic framework.
🟢 Market Structure Overview
The current structure is forming an ascending range with higher lows, suggesting bullish intent — but with no clear breakout above previous structural highs yet. The market is essentially building liquidity traps around premium zones, setting up for a potential expansion move.
🔶 Key Zones Identified
H4 Supply Blocks (Upper Resistance Areas)
Three H4-level order blocks are stacked above the current price, each representing potential points of liquidity absorption or reversal:
First Block: Minor resistance, likely to be breached.
Second Block: Main liquidity zone where sellers may become active.
Third Block: Final trap or target zone in case of aggressive bullish expansion.
Daily Demand Blocks (Deeper Support Areas)
Three major Daily order blocks are marked below. These are institutional accumulation zones and key areas for potential price reaction or reversal:
Zone 1: Short-term support
Zone 2: Mid-term support with stronger price memory
Zone 3: High-confluence zone likely to be defended if reached
📈 Scenario Projections
✅ Bullish Scenario (Primary Path - White Arrows)
Price may first revisit a minor H4 OB below.
If price breaks the local high, we expect movement toward the second and third H4 OBs.
A clean break of those zones confirms a bullish continuation structure.
⚠️ Bearish/Corrective Scenario (Alternative Path - Orange & White Arrows)
If price fails to break above the second H4 OB and shows signs of exhaustion or liquidity sweep:
We could see a sharp rejection.
Breakdown of support may lead to a drop toward the Daily OB at 3240, or even deeper levels near 3080 or 3000 if momentum strengthens.
🔍 Key Trading Insights
Wait for confirmation candles (impulse + volume spike) around order blocks before execution.
Monitor volume behavior at key zones — strong volume without movement can indicate absorption.
Daily blocks are ideal long entry zones if structure and reaction confirm institutional buying.
🎯 Conclusion
This dual scenario strategy based on H4 and Daily order blocks provides traders with a clear directional roadmap. The reaction to the middle H4 OB will be the turning point — either leading to a breakout rally or a breakdown into deeper institutional zones.
📌 Stay patient and let price reveal its intent around these engineered liquidity levels.
Disclaimer
The information and publications are not meant to be, and do not constitute, financial, investment, trading, or other types of advice or recommendations supplied or endorsed by TradingView. Read more in the Terms of Use.
Disclaimer
The information and publications are not meant to be, and do not constitute, financial, investment, trading, or other types of advice or recommendations supplied or endorsed by TradingView. Read more in the Terms of Use.