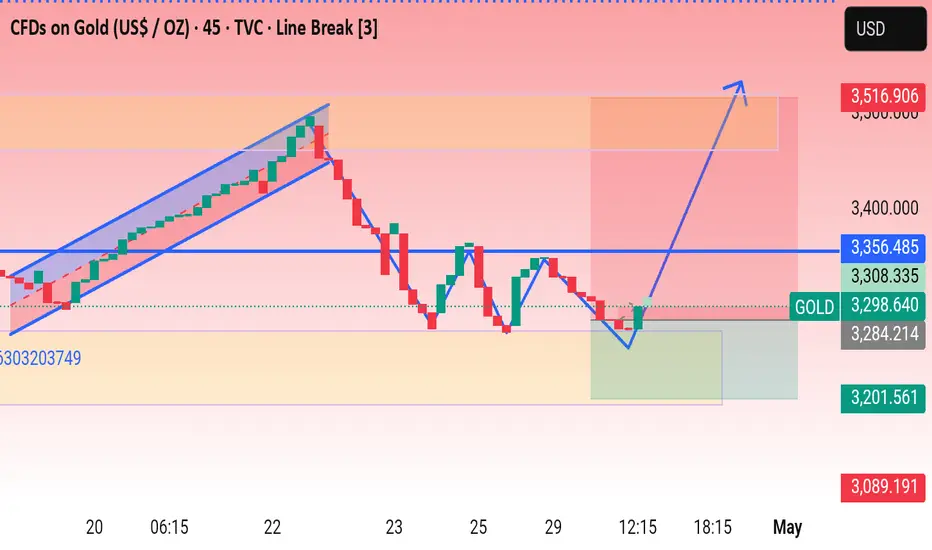
This is a technical analysis chart for CFDs on Gold (USD/OZ) using a 10-minute timeframe with the Line Break [3] chart type on TradingView.
Here's a breakdown of the key elements visible:
1. Current Price:
Buy: 3,303.036
Sell: 3,302.786
Market Price Label (GOLD): 3,305.030
2. Key Levels (marked on the right):
Support Zones: 3,054.178, 3,082.328, 3,089.191, 3,201.561, 3,284.214
Resistance Zones: 3,356.485, 3,516.906, 3,618.381
3. Technical Pattern:
There's a bullish projection drawn with a blue arrow, suggesting a potential breakout above the 3,356.485 resistance level.
The price action shows a correction or consolidation pattern following a sharp drop, indicating a possible bullish flag or inverse head-and-shoulders formation.
4. Indicators:
Highlighted colored zones (orange, red, green) likely represent supply and demand areas or Fibonacci retracement zones.
A horizontal blue line at around 3,356.485 is marked as a key resistance level.
5. Projected Move:
The chart anticipates a bullish breakout to possibly the 3,516 or 3,618 zone if the price breaks and closes above 3,356.485.
Would you like help analyzing the potential entry/exit points or setting stop-loss and take-profit levels?
Disclaimer
The information and publications are not meant to be, and do not constitute, financial, investment, trading, or other types of advice or recommendations supplied or endorsed by TradingView. Read more in the Terms of Use.
Disclaimer
The information and publications are not meant to be, and do not constitute, financial, investment, trading, or other types of advice or recommendations supplied or endorsed by TradingView. Read more in the Terms of Use.