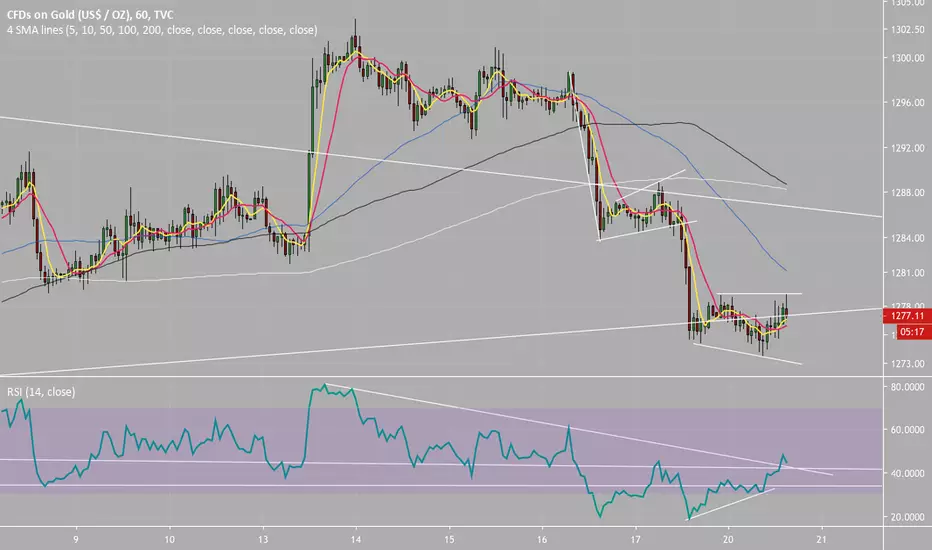
Gold's hourly chart RSI is reporting a bullish divergence of the RSI. A closer look at the price chart, however, reveals the yellow metal is forming bear flag pattern.
Downside break wouldn't be surprising. After all, lack of buyers despite the US stocks flashing red indicates the market sentiment is quite bearish.
Also on the hourly chart, major averages are trending south.
Downside break wouldn't be surprising. After all, lack of buyers despite the US stocks flashing red indicates the market sentiment is quite bearish.
Also on the hourly chart, major averages are trending south.
Disclaimer
The information and publications are not meant to be, and do not constitute, financial, investment, trading, or other types of advice or recommendations supplied or endorsed by TradingView. Read more in the Terms of Use.
Disclaimer
The information and publications are not meant to be, and do not constitute, financial, investment, trading, or other types of advice or recommendations supplied or endorsed by TradingView. Read more in the Terms of Use.