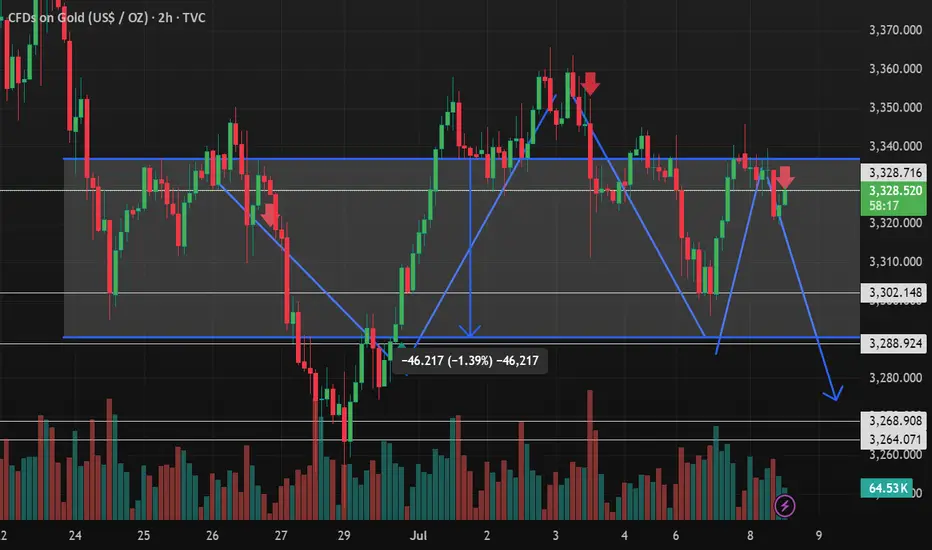
technical analysis chart for Gold (XAUUSD) on a 2-hour timeframe using TradingView. Let's break it down and analyze the key insights:
---
📉 Overall Trend
Currently bearish with lower highs and lower lows.
Price is struggling to break above the resistance around $3,340–$3,345.
---
🔍 Key Observations
1. Sell Zone (Red Arrow Marks):
Multiple sell signals shown with red arrows where price rejected the upper resistance levels.
Most recent rejection happened just above $3,328, where price failed to break higher.
2. Support Levels:
Strong support identified around $3,298, tested multiple times.
Next support zone appears near $3,280, shown with a projected downward arrow.
3. Pattern Formation:
A Head and Shoulders pattern may be forming — a bearish reversal signal.
Alternatively, this also looks like a range or a bearish flag in a continuation of the prior downtrend.
4. Volume Analysis:
Noticeable increase in bearish volume on recent candles, supporting the downward movement.
Bullish volume appears weaker in comparison.
---
🔮 Possible Scenario (Bearish Bias)
If the price fails to reclaim and close above $3,328–$3,330, a drop to $3,298 is likely.
If $3,298 breaks with strong volume, next target could be around $3,280 or even lower as marked by the blue arrows.
Measured move from the top to the neckline supports this downside projection.
---
📌 Key Levels to Watch
Type Level
Resistance $3,328 – $3,345
Support $3,298.26
Target $3,280 – $3,264
Entry Signal Below $3,298 with volume
---
✅ Strategy Suggestion
Short Bias: Wait for a breakdown below $3,298 with strong volume confirmation.
Invalidation: If price closes and holds above $3,345, bearish setup fails.
Risk Management: Place stop-loss above $3,345, target $3,280–$3,264.
---
Would you like help setting up a trading plan, or converting this analysis into a Pine Script strategy?
---
📉 Overall Trend
Currently bearish with lower highs and lower lows.
Price is struggling to break above the resistance around $3,340–$3,345.
---
🔍 Key Observations
1. Sell Zone (Red Arrow Marks):
Multiple sell signals shown with red arrows where price rejected the upper resistance levels.
Most recent rejection happened just above $3,328, where price failed to break higher.
2. Support Levels:
Strong support identified around $3,298, tested multiple times.
Next support zone appears near $3,280, shown with a projected downward arrow.
3. Pattern Formation:
A Head and Shoulders pattern may be forming — a bearish reversal signal.
Alternatively, this also looks like a range or a bearish flag in a continuation of the prior downtrend.
4. Volume Analysis:
Noticeable increase in bearish volume on recent candles, supporting the downward movement.
Bullish volume appears weaker in comparison.
---
🔮 Possible Scenario (Bearish Bias)
If the price fails to reclaim and close above $3,328–$3,330, a drop to $3,298 is likely.
If $3,298 breaks with strong volume, next target could be around $3,280 or even lower as marked by the blue arrows.
Measured move from the top to the neckline supports this downside projection.
---
📌 Key Levels to Watch
Type Level
Resistance $3,328 – $3,345
Support $3,298.26
Target $3,280 – $3,264
Entry Signal Below $3,298 with volume
---
✅ Strategy Suggestion
Short Bias: Wait for a breakdown below $3,298 with strong volume confirmation.
Invalidation: If price closes and holds above $3,345, bearish setup fails.
Risk Management: Place stop-loss above $3,345, target $3,280–$3,264.
---
Would you like help setting up a trading plan, or converting this analysis into a Pine Script strategy?
Bast Account manager
🔔Account Management Available
🔊Equity Minimum 500$
🔕50/50 Share
🏀Proper Risk
🎈85% Accuracy
Account management available here👆👆
🎁Contact Admin @MAJOUR123
🔔Account Management Available
🔊Equity Minimum 500$
🔕50/50 Share
🏀Proper Risk
🎈85% Accuracy
Account management available here👆👆
🎁Contact Admin @MAJOUR123
Disclaimer
The information and publications are not meant to be, and do not constitute, financial, investment, trading, or other types of advice or recommendations supplied or endorsed by TradingView. Read more in the Terms of Use.