1. Resistance Zone Already Tested
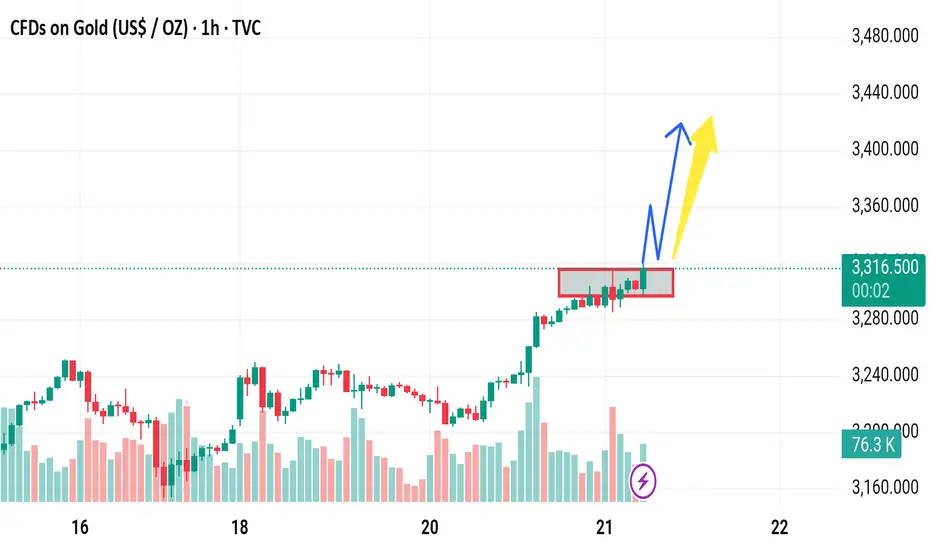
The price is currently testing a resistance zone (highlighted in red). Historically, prices have reversed from such levels unless there's a strong breakout catalyst. Without a clear breakout and volume confirmation above this zone, a reversal is plausible.
Bearish View:
If price fails to close decisively above 3,320–3,325, it may indicate a double top or false breakout setup, leading to a correction back toward 3,275 or lower.
---
2. Volume Divergence
Look at the declining volume bars while price pushes upward. This is a bearish divergence, suggesting weakening momentum behind the rally.
Bearish Implication:
Without increasing volume, the current move may lack the strength to sustain higher levels, opening the door for a pullback.
---
3. Overbought Short-Term RSI (not shown)
Assuming an RSI or momentum oscillator is present (often used with this type of analysis), there’s a high likelihood it is nearing overbought levels based on recent price action.
Bearish Risk:
Overbought conditions often precede short-term pullbacks or consolidations.
---
4. Potential Fake Breakout (Bull Trap)
The blue and yellow arrows suggest a breakout and continuation. However, a fakeout above resistance (bull trap) could lure buyers in before a reversal.
Disruption Scenario:
Price spikes above the resistance zone briefly, then sharply reverses and closes below the red box, leading to a fast drop as trapped longs exit.
t.me/gold_free_signals1
𝙁𝙤𝙧𝙚𝙭 𝙩𝙧𝙖𝙙𝙞𝙣𝙜 𝙚𝙭𝙥𝙚𝙧𝙞𝙚𝙣𝙘𝙚 𝙩𝙚𝙖𝙢 ☺️ 𝙢𝙖𝙣𝙖𝙜𝙚 𝙮𝙤𝙪𝙧 𝙖𝙘𝙘𝙤𝙪𝙣𝙩 𝙢𝙖𝙠𝙞𝙣𝙜 𝙢𝙤𝙣𝙚𝙮 🤑💰
t.me/gold_free_signals1
𝙁𝙤𝙧𝙚𝙭 𝙩𝙧𝙖𝙙𝙞𝙣𝙜 𝙚𝙭𝙥𝙚𝙧𝙞𝙚𝙣𝙘𝙚 𝙩𝙚𝙖𝙢 ☺️ 𝙢𝙖𝙣𝙖𝙜𝙚 𝙮𝙤𝙪𝙧 𝙖𝙘𝙘𝙤𝙪𝙣𝙩 𝙢𝙖𝙠𝙞𝙣𝙜 𝙢𝙤𝙣𝙚𝙮 🤑💰
t.me/gold_free_signals1
Disclaimer
The information and publications are not meant to be, and do not constitute, financial, investment, trading, or other types of advice or recommendations supplied or endorsed by TradingView. Read more in the Terms of Use.
t.me/gold_free_signals1
𝙁𝙤𝙧𝙚𝙭 𝙩𝙧𝙖𝙙𝙞𝙣𝙜 𝙚𝙭𝙥𝙚𝙧𝙞𝙚𝙣𝙘𝙚 𝙩𝙚𝙖𝙢 ☺️ 𝙢𝙖𝙣𝙖𝙜𝙚 𝙮𝙤𝙪𝙧 𝙖𝙘𝙘𝙤𝙪𝙣𝙩 𝙢𝙖𝙠𝙞𝙣𝙜 𝙢𝙤𝙣𝙚𝙮 🤑💰
t.me/gold_free_signals1
𝙁𝙤𝙧𝙚𝙭 𝙩𝙧𝙖𝙙𝙞𝙣𝙜 𝙚𝙭𝙥𝙚𝙧𝙞𝙚𝙣𝙘𝙚 𝙩𝙚𝙖𝙢 ☺️ 𝙢𝙖𝙣𝙖𝙜𝙚 𝙮𝙤𝙪𝙧 𝙖𝙘𝙘𝙤𝙪𝙣𝙩 𝙢𝙖𝙠𝙞𝙣𝙜 𝙢𝙤𝙣𝙚𝙮 🤑💰
t.me/gold_free_signals1
Disclaimer
The information and publications are not meant to be, and do not constitute, financial, investment, trading, or other types of advice or recommendations supplied or endorsed by TradingView. Read more in the Terms of Use.