📊 Technical Analysis of Gold (XAU/USD) – 30-Min Chart
Chart Context:
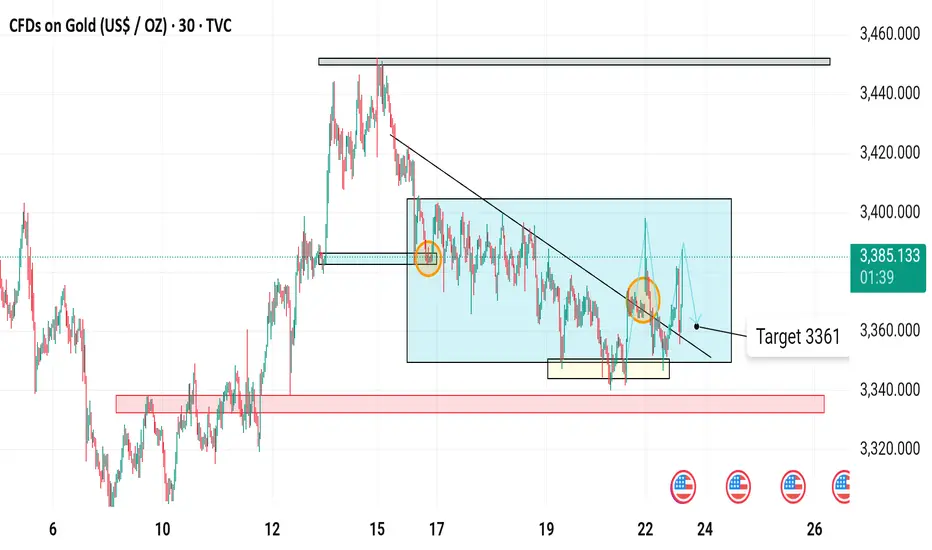
Timeframe: 30-minute
Instrument: CFDs on Gold (USD/OZ)
Current Price: $3,386.282
Price Change: +14.757 (+0.44%)
Date: June 23, 2025
---
🔍 Key Observations:
1. Descending Triangle Formation
The chart shows a descending triangle, characterized by:
A flat support zone around the $3,351–$3,355 range.
A descending resistance trendline, suggesting lower highs over time.
This is typically a bearish pattern, indicating that sellers are pressuring price lower.
2. Breakout and Retest
There was a recent breakout above the descending trendline (highlighted with a blue move).
However, the price may be performing a false breakout or retest, as a downward arrow suggests a potential reversal back toward the support.
3. Volume and Market Sentiment
Although volume is not shown, the chart’s structure implies selling pressure is still dominant after each rally is rejected.
Price remains within a consolidation box, indicating indecision — but leaning bearish due to the triangle pattern.
---
🎯 Target: $3,361
The label "Target 3361" marks a likely support level if the bearish pattern plays out.
This is a measured move from the triangle height and structure, projecting downward from the breakdown point.
---
🛑 Support Zones
Strong demand zones highlighted in red between $3,325–$3,340.
If price breaks below $3,351, expect a drop to $3,325–$3,330, which are historical demand areas.
Chart Context:
Timeframe: 30-minute
Instrument: CFDs on Gold (USD/OZ)
Current Price: $3,386.282
Price Change: +14.757 (+0.44%)
Date: June 23, 2025
---
🔍 Key Observations:
1. Descending Triangle Formation
The chart shows a descending triangle, characterized by:
A flat support zone around the $3,351–$3,355 range.
A descending resistance trendline, suggesting lower highs over time.
This is typically a bearish pattern, indicating that sellers are pressuring price lower.
2. Breakout and Retest
There was a recent breakout above the descending trendline (highlighted with a blue move).
However, the price may be performing a false breakout or retest, as a downward arrow suggests a potential reversal back toward the support.
3. Volume and Market Sentiment
Although volume is not shown, the chart’s structure implies selling pressure is still dominant after each rally is rejected.
Price remains within a consolidation box, indicating indecision — but leaning bearish due to the triangle pattern.
---
🎯 Target: $3,361
The label "Target 3361" marks a likely support level if the bearish pattern plays out.
This is a measured move from the triangle height and structure, projecting downward from the breakdown point.
---
🛑 Support Zones
Strong demand zones highlighted in red between $3,325–$3,340.
If price breaks below $3,351, expect a drop to $3,325–$3,330, which are historical demand areas.
Trade active
Trade closed: target reached
🔗 t.me/+VTrdWh5R_scwMGM0
✅ All PAIRS SIGNALS PROVIDE FIRST VISIT THEN JOIN
🔗 t.me/+jODseb0iIvxiNjc0
✅ REGISTER UNDER THE WORLD BEST BROKER
🔗 one.exnesstrack.org/a/6yzdfvn1po
✅ All PAIRS SIGNALS PROVIDE FIRST VISIT THEN JOIN
🔗 t.me/+jODseb0iIvxiNjc0
✅ REGISTER UNDER THE WORLD BEST BROKER
🔗 one.exnesstrack.org/a/6yzdfvn1po
Disclaimer
The information and publications are not meant to be, and do not constitute, financial, investment, trading, or other types of advice or recommendations supplied or endorsed by TradingView. Read more in the Terms of Use.