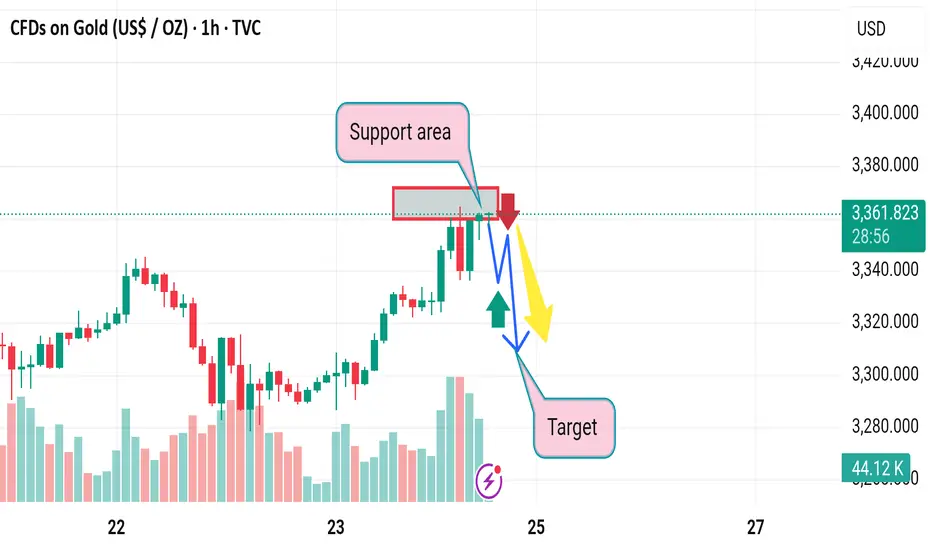
1. Misinterpretation of Support Area
Claimed support area has already been broken previously (left of the red box), so it's no longer strong support—it might be better viewed as resistance now.
The bounce from this zone could be a liquidity trap or a fakeout, rather than genuine buying interest.
---
2. Overreliance on a Single Target Zone
The chart implies a clear target zone below, but no Fibonacci, moving average, or volume profile is shown to validate this zone.
A better analysis might include additional tools (like RSI, Bollinger Bands, or Fibonacci levels) to confirm this as a realistic target.
---
3. Volume Analysis Oversight
There is a volume spike on the most recent bullish candles, which could indicate strong buying interest, contradicting the downtrend expectation.
This might suggest a potential breakout above resistance instead of a fall.
---
4. No Risk Management Consideration
The chart lacks stop-loss levels or invalidation points, which is crucial for trading strategies.
Without a clear invalidation, the trade idea becomes more speculative.
---
5. Alternative Scenario Missing
A bullish breakout scenario (above resistance zone) isn’t given enough weight.
Given the recent strength, there is a strong case for continuation upward if the price closes above the red box with volume.
Disclaimer
The information and publications are not meant to be, and do not constitute, financial, investment, trading, or other types of advice or recommendations supplied or endorsed by TradingView. Read more in the Terms of Use.
Disclaimer
The information and publications are not meant to be, and do not constitute, financial, investment, trading, or other types of advice or recommendations supplied or endorsed by TradingView. Read more in the Terms of Use.