Trend Analysis
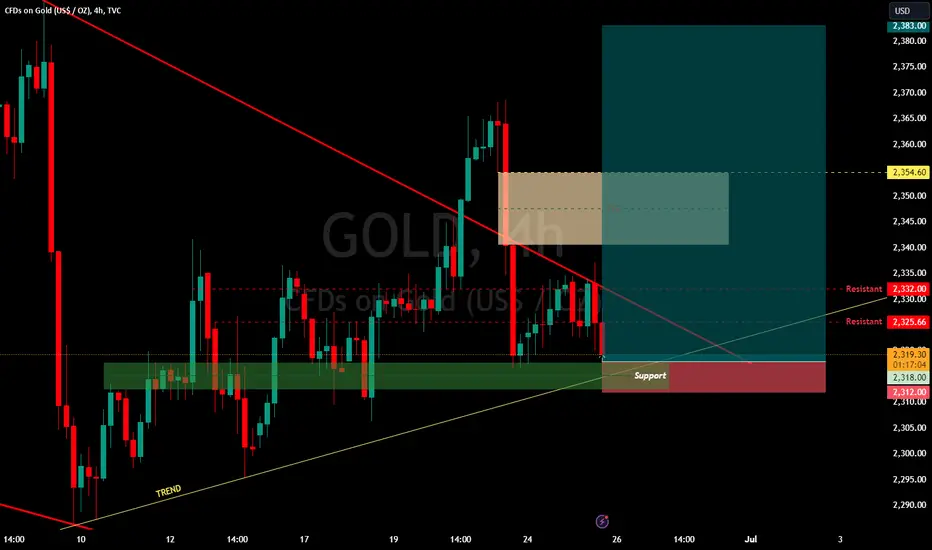
Downward Trend Line: There is a red downward trend line indicating that gold has been in a downtrend. This line acts as a resistance level.
Support Zone: There is a green support zone around the $2,318.00 level. This indicates that there is buying interest around this price, and it has historically acted as a support level.
Resistance Levels
First Resistance: Around $2,325.66.
Second Resistance: Around $2,332.00.
These resistance levels indicate where selling pressure has previously been strong enough to halt upward price movement.
Fair Value Gap (FVG)
A Fair Value Gap is highlighted in a beige rectangle from approximately $2,340.00 to $2,354.60. This gap suggests an area where the price might move quickly if it enters this zone, potentially due to a lack of liquidity or previous rapid price movement.
Price Action
Current Price: As of the latest data on the chart, gold is trading at $2,319.26.
Recent Movement: The price recently bounced off the support zone but faced resistance near $2,332.00, aligning with the downward trend line.
Potential Scenarios
Bullish Scenario: If the price can break above the resistance at $2,325.66 and subsequently the downward trend line, it may target the next resistance level at $2,332.00. A break above this level could lead to a move towards the Fair Value Gap, potentially reaching the upper boundary around $2,354.60.
Bearish Scenario: If the price fails to hold the support level at $2,318.00, it might move lower, with the next significant support level potentially being around $2,312.00. Further bearish movement could target levels below $2,310.00.
Key Levels to Watch
Support: $2,318.00, $2,312.00.
Resistance: $2,325.66, $2,332.00, $2,354.60 (FVG zone).
Note
Note
did you see this ??
Disclaimer
The information and publications are not meant to be, and do not constitute, financial, investment, trading, or other types of advice or recommendations supplied or endorsed by TradingView. Read more in the Terms of Use.
Disclaimer
The information and publications are not meant to be, and do not constitute, financial, investment, trading, or other types of advice or recommendations supplied or endorsed by TradingView. Read more in the Terms of Use.