Disruption (Bearish Scenario):
1. False Breakout Risk:
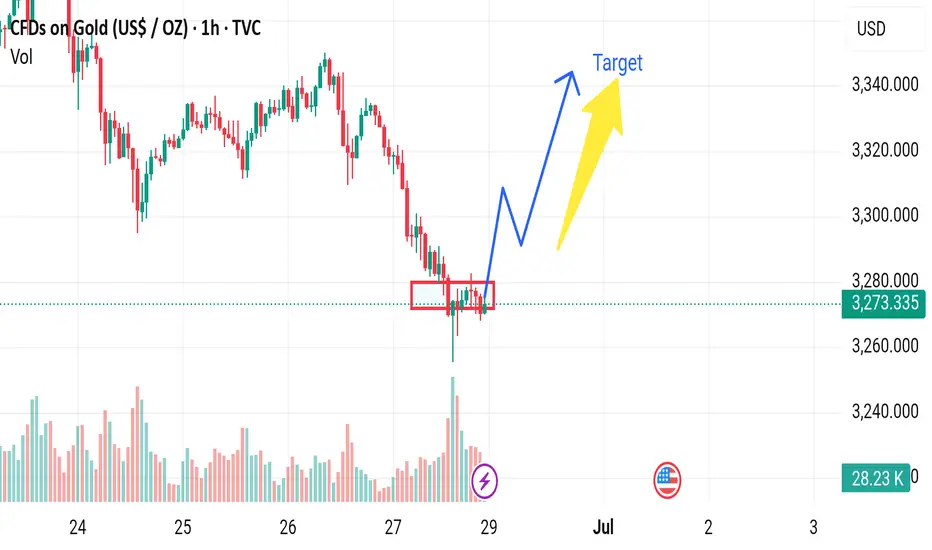
The price has recently tested the lower support range (red boxes) several times without strong follow-through. This could suggest weak buying momentum.
2. Volume Spike Trap:
The large volume spike on the wick down may represent stop-loss hunting or a liquidity grab rather than true accumulation. If it were strong accumulation, we would expect a more sustained bounce.
3. Resistance Zone Ahead:
The price is nearing resistance around $3,275–$3,280, where previous breakdowns started. If it fails to break above this zone decisively, a rejection and continued downtrend is possible.
4. Lower High Formation:
The most recent price action could form a lower high, suggesting a continuation of the bearish trend instead of a reversal.
---
🔽 Bearish Path (Alternative Projection):
Price retests $3,275–$3,280, fails to break out.
Drops below the red box support (~$3,260).
Heads toward the next support levels around $3,240 or lower.
📉 "Target becomes invalidated if price fails to hold above the red box support zone."
1. False Breakout Risk:
The price has recently tested the lower support range (red boxes) several times without strong follow-through. This could suggest weak buying momentum.
2. Volume Spike Trap:
The large volume spike on the wick down may represent stop-loss hunting or a liquidity grab rather than true accumulation. If it were strong accumulation, we would expect a more sustained bounce.
3. Resistance Zone Ahead:
The price is nearing resistance around $3,275–$3,280, where previous breakdowns started. If it fails to break above this zone decisively, a rejection and continued downtrend is possible.
4. Lower High Formation:
The most recent price action could form a lower high, suggesting a continuation of the bearish trend instead of a reversal.
---
🔽 Bearish Path (Alternative Projection):
Price retests $3,275–$3,280, fails to break out.
Drops below the red box support (~$3,260).
Heads toward the next support levels around $3,240 or lower.
📉 "Target becomes invalidated if price fails to hold above the red box support zone."
Disclaimer
The information and publications are not meant to be, and do not constitute, financial, investment, trading, or other types of advice or recommendations supplied or endorsed by TradingView. Read more in the Terms of Use.
Disclaimer
The information and publications are not meant to be, and do not constitute, financial, investment, trading, or other types of advice or recommendations supplied or endorsed by TradingView. Read more in the Terms of Use.