🟢 Chart Instrument
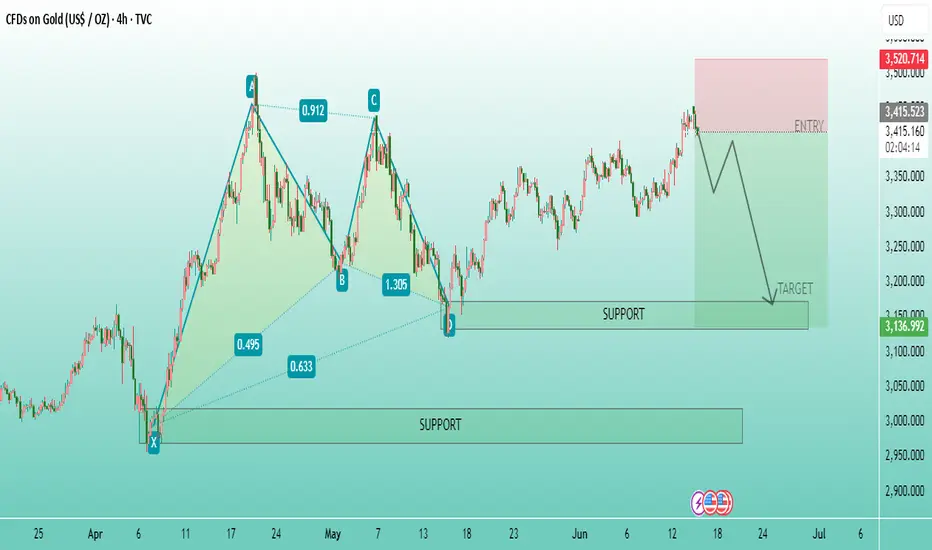
Symbol: CFDs on Gold (US$/OZ) – XAU/USD
Timeframe: 4H (4-hour candles)
Platform: TradingView
---
📐 Harmonic Pattern
The chart displays a Bearish Gartley pattern, typically identified by the labeled points X-A-B-C-D.
This pattern suggests a potential reversal from point D downward.
Fibonacci ratios are visible:
AB = 0.618 retracement of XA
BC = 0.886 retracement of AB
CD = 1.27–1.618 extension of BC
Pattern completes at point D (where the short trade is suggested).
---
📉 Trade Setup (Short/Sell Bias)
Entry Zone: Around 3,415 – 3,520 USD (highlighted red zone)
Target Zone: Near 3,135 USD (marked “TARGET”)
Stop Loss Zone: Above 3,520 USD (indicated in red box)
Expected Movement: Sharp drop from resistance area to target support zone.
---
🧱 Support Zones
Two key support levels are marked:
1. First target zone at ~3,135
2. Broader support range: 3,000 – 3,080
These support levels are likely areas where price could reverse or consolidate after falling.
---
📆 Timeframe Focus
The projection extends toward Wednesday, June 25, suggesting this is a medium-term swing setup over the coming 1–2 weeks.
---
✅ Summary
Pattern Type: Bearish Gartley
Action Plan: Wait for price to hit entry zone (point D), then short with target at 3,135.
Risk/Reward: Clearly defined with stop-loss and target zones
Trade active
350 pips runing we wait for moreFree Accurate GOLD Signals Quality Education 🎓Quality Analysis 🔥🔥High Impact News Livetrades Accuracy 💯💯 All FREE!
Disclaimer
The information and publications are not meant to be, and do not constitute, financial, investment, trading, or other types of advice or recommendations supplied or endorsed by TradingView. Read more in the Terms of Use.
Free Accurate GOLD Signals Quality Education 🎓Quality Analysis 🔥🔥High Impact News Livetrades Accuracy 💯💯 All FREE!
Disclaimer
The information and publications are not meant to be, and do not constitute, financial, investment, trading, or other types of advice or recommendations supplied or endorsed by TradingView. Read more in the Terms of Use.