GOLD/USD Bearish Rejection at Resistance 📉🟥
🔍 Technical Analysis Overview:
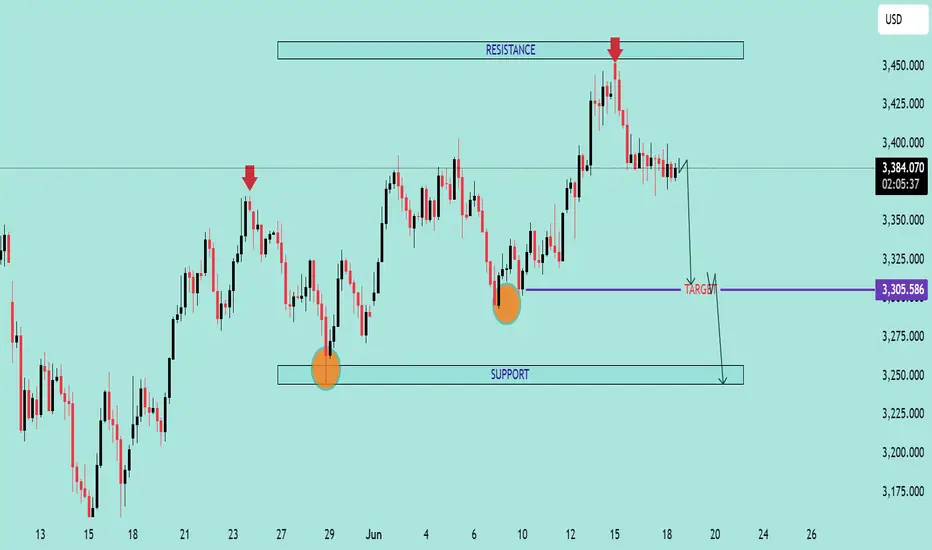
The GOLD/USD chart shows a clear bearish rejection pattern forming near the resistance zone around $3,450, marked with red arrows. After price tested this level twice, strong selling pressure appeared, resulting in a sharp decline.
📌 Key Observations:
🔴 Resistance Zone:
Price was rejected from the resistance area around $3,450 twice, indicating strong seller presence.
Double top-like behavior seen with lower highs confirming weakening bullish momentum.
🟠 Support Zone:
A well-respected support level near $3,250 has been identified based on past reaction (highlighted with orange circles).
Price previously bounced twice from this zone, validating it as a strong support level.
🎯 Target Level:
A near-term target of $3,305.586 is marked, which aligns with previous reaction zones and short-term structure support.
If momentum continues, a deeper push toward $3,250 support is probable.
📉 Bearish Bias Justified By:
Clear rejection from resistance
Lower high formation
Current consolidation with downward bias
Possible breakout to downside if $3,305 fails to hold
⚠️ Risk Note:
If price retraces and breaks back above $3,400 with volume, the bearish setup will be invalidated.
📊 Conclusion:
The chart favors bearish continuation with a primary target around $3,305, and extended downside to $3,250 if bearish pressure sustains. Traders should watch for bearish confirmation patterns below current price before engaging.
🔽 Resistance: $3,450
🔼 Support: $3,250
🎯 Target: $3,305
🔍 Technical Analysis Overview:
The GOLD/USD chart shows a clear bearish rejection pattern forming near the resistance zone around $3,450, marked with red arrows. After price tested this level twice, strong selling pressure appeared, resulting in a sharp decline.
📌 Key Observations:
🔴 Resistance Zone:
Price was rejected from the resistance area around $3,450 twice, indicating strong seller presence.
Double top-like behavior seen with lower highs confirming weakening bullish momentum.
🟠 Support Zone:
A well-respected support level near $3,250 has been identified based on past reaction (highlighted with orange circles).
Price previously bounced twice from this zone, validating it as a strong support level.
🎯 Target Level:
A near-term target of $3,305.586 is marked, which aligns with previous reaction zones and short-term structure support.
If momentum continues, a deeper push toward $3,250 support is probable.
📉 Bearish Bias Justified By:
Clear rejection from resistance
Lower high formation
Current consolidation with downward bias
Possible breakout to downside if $3,305 fails to hold
⚠️ Risk Note:
If price retraces and breaks back above $3,400 with volume, the bearish setup will be invalidated.
📊 Conclusion:
The chart favors bearish continuation with a primary target around $3,305, and extended downside to $3,250 if bearish pressure sustains. Traders should watch for bearish confirmation patterns below current price before engaging.
🔽 Resistance: $3,450
🔼 Support: $3,250
🎯 Target: $3,305
JOIN MY TELEGRAM CHANNEL
t.me/StellarMarketAnalysis
JOIN MY RECOMMENTED BROKER REFFREL LINK
⤵️one.exnesstrack.net/a/uvd1etcgg1
PARTNER CODE⤵️
uvd1etcgg1
t.me/StellarMarketAnalysis
JOIN MY RECOMMENTED BROKER REFFREL LINK
⤵️one.exnesstrack.net/a/uvd1etcgg1
PARTNER CODE⤵️
uvd1etcgg1
Disclaimer
The information and publications are not meant to be, and do not constitute, financial, investment, trading, or other types of advice or recommendations supplied or endorsed by TradingView. Read more in the Terms of Use.