Analysis:
Price Action (Top Section of Chart)
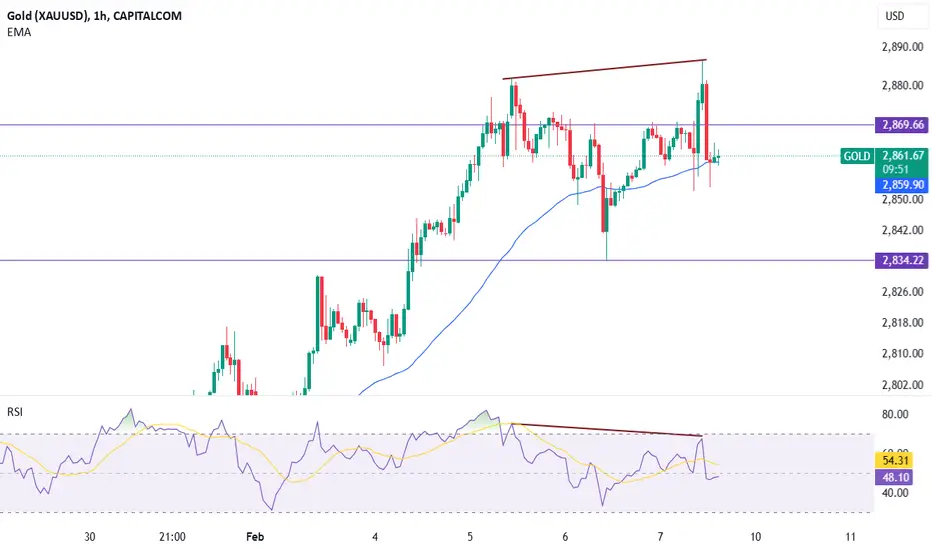
The price is making higher highs (shown with the upper trendline).
Relative Strength Index (RSI) (Bottom Section of Chart)
The RSI is making lower highs (shown with the downward trendline).
This is a bearish divergence, meaning that while the price is rising, the RSI is weakening, indicating that momentum is fading. This often suggests a potential reversal or pullback in price.
Confirmation:
The price has already started reacting to this divergence, showing some rejection from the highs.
The RSI dropping below 50 is an additional bearish signal.
If the price falls below support (around 2,864.95 EMA and 2,834.22 horizontal support), the bearish move could accelerate.
Price Action (Top Section of Chart)
The price is making higher highs (shown with the upper trendline).
Relative Strength Index (RSI) (Bottom Section of Chart)
The RSI is making lower highs (shown with the downward trendline).
This is a bearish divergence, meaning that while the price is rising, the RSI is weakening, indicating that momentum is fading. This often suggests a potential reversal or pullback in price.
Confirmation:
The price has already started reacting to this divergence, showing some rejection from the highs.
The RSI dropping below 50 is an additional bearish signal.
If the price falls below support (around 2,864.95 EMA and 2,834.22 horizontal support), the bearish move could accelerate.
Disclaimer
The information and publications are not meant to be, and do not constitute, financial, investment, trading, or other types of advice or recommendations supplied or endorsed by TradingView. Read more in the Terms of Use.
Disclaimer
The information and publications are not meant to be, and do not constitute, financial, investment, trading, or other types of advice or recommendations supplied or endorsed by TradingView. Read more in the Terms of Use.