💸GOLD💸
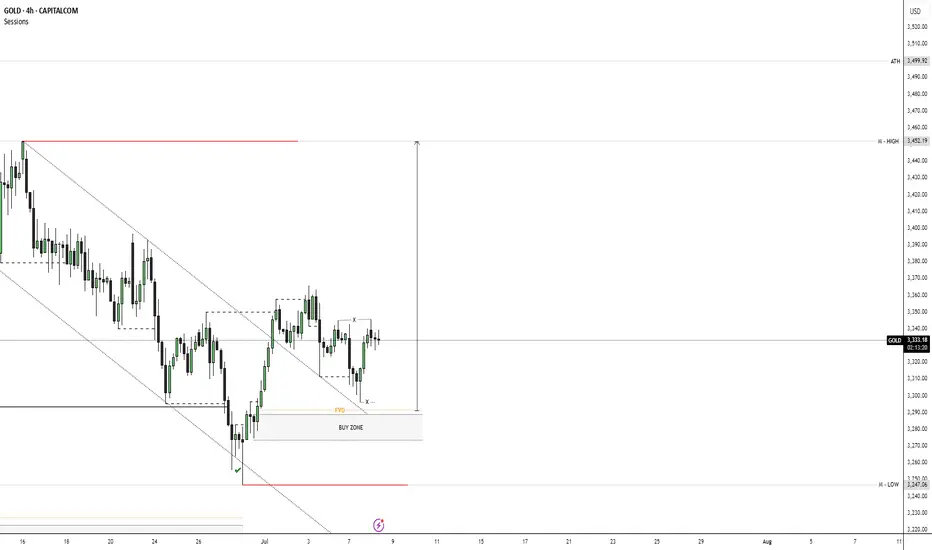
📉 Trend Overview
• Prior Structure: Market was in a strong downtrend, shown by descending highs and lower lows.
• Break of Structure: Price broke out of the descending trendline, indicating a potential bullish reversal or at least a deeper correction.
• Current Structure: The market is consolidating after an impulsive bullish move, forming a range or re-accumulation.
⸻
🔍 Key Observations
✅ Break of Downtrend
• Price has clearly broken the descending trendline — first sign of bullish strength.
• After the break, price created a higher high and pulled back — confirming a market structure shift.
📌 Fair Value Gap (FVG) & Buy Zone
• FVG identified below current price — this is often a liquidity gap where institutions may return to mitigate orders.
• The Buy Zone aligns with the FVG — making it a high-probability demand area.
• Price could wick into this zone before making the next bullish leg.
🧱 Range Formation
• Multiple touches at resistance (marked by “X”) indicate price is currently accumulating liquidity.
• Consolidation within a clear range suggests build-up before breakout.
⸻
📈 Possible Scenarios
🟩 Bullish Case
• Price revisits the Buy Zone / FVG area.
• Bullish reaction from this zone can lead to a break above the consolidation range.
• First target: previous high / top of the chart projection (marked with an arrow).
• Extended target: Implied liquidity above the highest resistance zone.
🟥 Bearish Invalidations
• A clean break below the Buy Zone and failure to react at the FVG suggests:
• Weak bullish momentum.
• Potential return to lower lows.
⸻
✅ Confluences Supporting Longs
• Market Structure Break.
• FVG + Demand Zone alignment.
• Trendline breakout.
• Range liquidity building up.
• Higher low formation.
⸻
🕵️♂️ What to Watch For
• Bullish engulfing or reversal pattern in the Buy Zone.
• Breakout candle with volume above consolidation.
• Retest of broken structure for confirmation.
Trade active
Disclaimer
The information and publications are not meant to be, and do not constitute, financial, investment, trading, or other types of advice or recommendations supplied or endorsed by TradingView. Read more in the Terms of Use.
Disclaimer
The information and publications are not meant to be, and do not constitute, financial, investment, trading, or other types of advice or recommendations supplied or endorsed by TradingView. Read more in the Terms of Use.