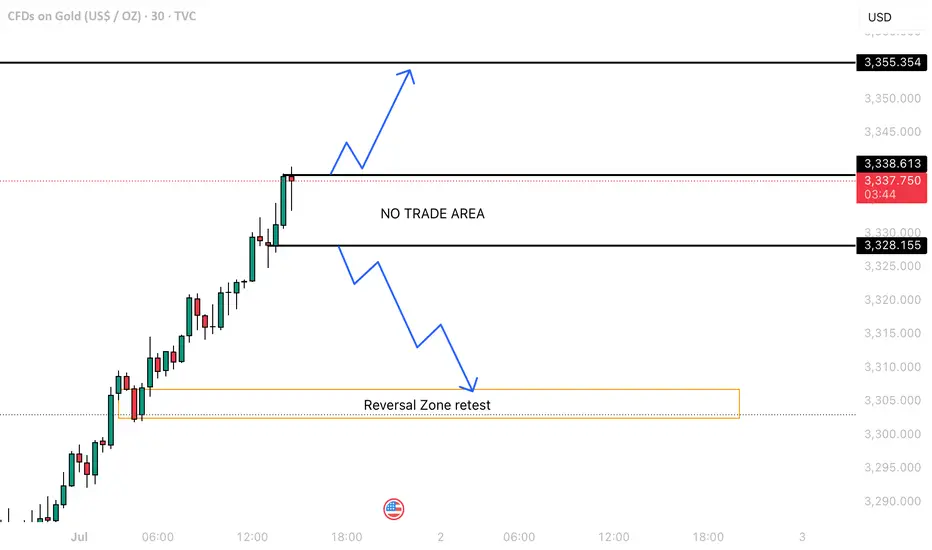
Currently, price action on the 30-minute chart is showing signs of weakness as it hovers near a key support level at around 3328. The chart has been respecting an ascending trendline, but now we see price attempting to break below this trendline 📉.
🔸 Resistance Zone: 3338
🔸 Support Zone: 3328
🔸 Bearish Target Area: 3315–3300 region
🚨 If the price breaks below the support and the ascending trendline is invalidated, we may see further downside movement, with a potential target near the 3300 zone, which aligns with a previous demand area.
🛑 Watch for confirmation (bearish engulfing candle or retest rejection) before entering a short position.
💡 Bias: Bearish below 3328
📌 Next Key Support: 3290
Let me know your thoughts in the comments! 💬
📊 Trade safe and always manage your risk! 🛡️
Trade active
Trade active London session trader massive move 60 pips above now hold with stop loss trail and enjoy trade Follow risk management
Follow my chart for more updates
Trade closed: target reached
Target achieve by 130 pips easily Gold break resistance easy chart pattern Follow my chart for more updates on gold
Follow me
Disclaimer
The information and publications are not meant to be, and do not constitute, financial, investment, trading, or other types of advice or recommendations supplied or endorsed by TradingView. Read more in the Terms of Use.
Disclaimer
The information and publications are not meant to be, and do not constitute, financial, investment, trading, or other types of advice or recommendations supplied or endorsed by TradingView. Read more in the Terms of Use.