SMC Trading point update
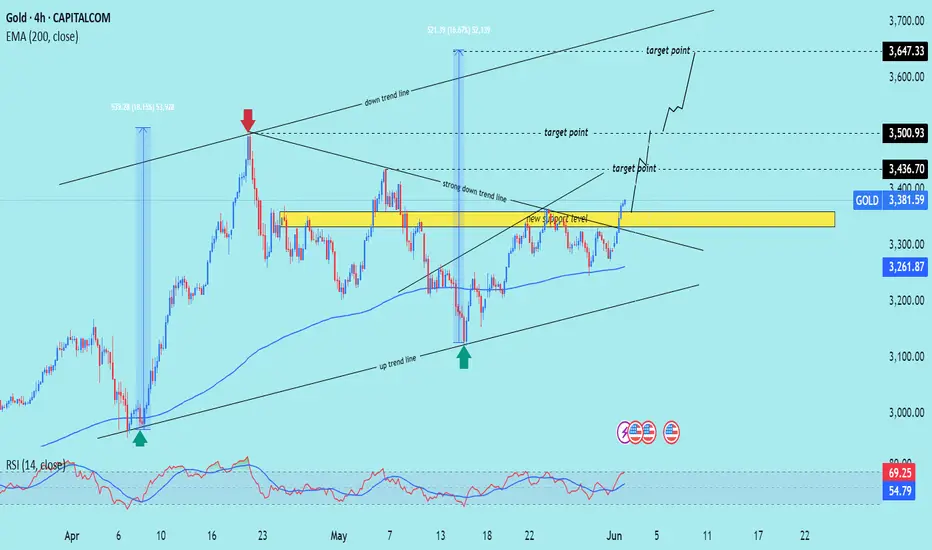
Technical analysis chart of gold (XAUUSD) on the 4-hour timeframe. Here’s a breakdown of the key ideas presented in the chart:
---
Key Support/Resistance Zone
A yellow rectangular zone marks a significant support/resistance level.
This level was previously a resistance and has now been flipped into support ("new support level").
---
Trend Analysis
Uptrend line (lower diagonal line): Shows support and higher lows forming a bullish structure.
Downtrend lines (upper diagonals): Show past resistance levels being tested.
Strong downtrend line has now been broken, which is bullish.
---
Target Points
Three bullish targets are marked:
1. $3,436.70
2. $3,500.93
3. $3,647.33
These targets seem to be based on:
Breakout above the resistance zone.
Measured move projections from previous impulsive rallies.
---
Technical Indicators
200 EMA (Exponential Moving Average): Currently at $3,261.87, acting as dynamic support.
RSI (Relative Strength Index):
Current RSI is 54.80, indicating neutral momentum.
Previously touched overbought zone (~69), indicating strong recent bullish momentum.
---
Arrows
Green arrows mark strong bullish bounce points.
Red arrow marks a rejection from the downtrend line (previous resistance).
Mr SMC Trading point
---
Conclusion (Idea Summary)
Price has broken out of consolidation and downtrend resistance.
If the price holds above the yellow support zone and 200 EMA, a bullish continuation is likely.
Targets: $3,436 → $3,501 → $3,647.
Confirmation of breakout and momentum depends on volume and RSI behavior in coming candles.
---
pelas support boost 🚀 analysis follow)
Trade active
(Services:✔️ JOIN Telegram channel
#Gold trading ★Analysis★ 📊
Gold trading signals 🚀 99%
t.me/SmcTradingPoin
Join my recommended broker , link 👇
World best broker exness ✅D
one.exnesstrack.org/a/l1t1rf3p6v
#Gold trading ★Analysis★ 📊
Gold trading signals 🚀 99%
t.me/SmcTradingPoin
Join my recommended broker , link 👇
World best broker exness ✅D
one.exnesstrack.org/a/l1t1rf3p6v
Related publications
Disclaimer
The information and publications are not meant to be, and do not constitute, financial, investment, trading, or other types of advice or recommendations supplied or endorsed by TradingView. Read more in the Terms of Use.